Archived Insight | January 5, 2018
How Equity Returns in 2017 Proved Powerful
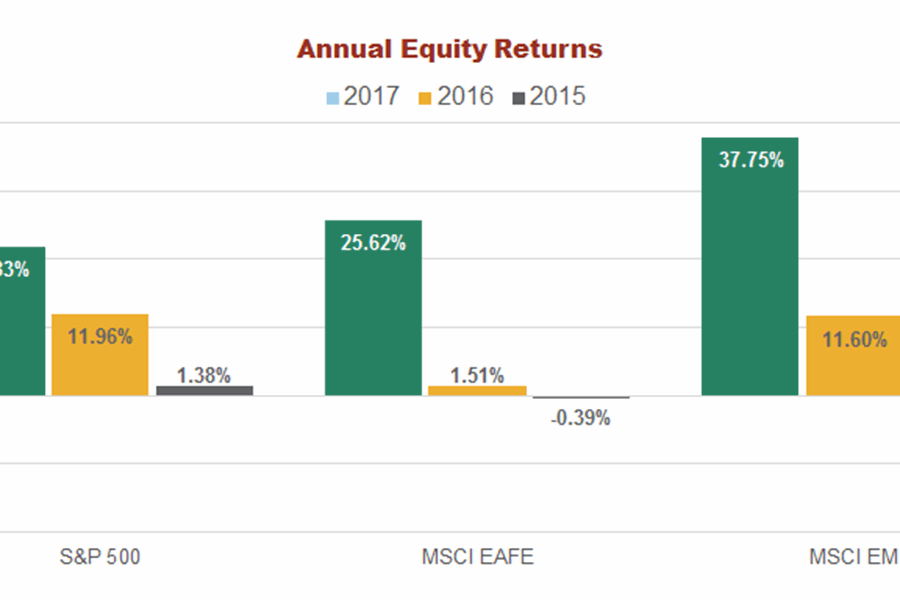
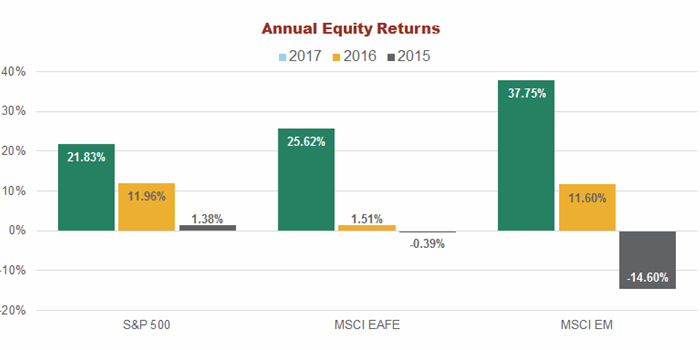
Equity investors should be quite pleased with 2017’s full-year results on a global scale.

All of the major equity indices ended the year with double-digit positive returns – significant double-digits, in fact. Emerging markets saw the greatest return, but investors in U.S. and non-U.S. developed markets also saw significant gains for the year.
And we thought 2016 ended pretty well…2017 made those strong gains look minor.
U.S.
All style and size returns were solidly positive. In terms of core market capitalization, large caps fared a bit better than mid caps and better still than small caps. Looking at growth and value, growth’s return was more than double that of value within each market cap when looking at the Russell indices.
| Value | Core | Growth | ||
| Large Cap (Russell 1000) | 13.66% | 21.69% | 30.21% | |
| Mid Cap (Russell Mid Cap) | 13.34% | 18.52% | 25.27% | |
| Small Cap (Russell 2000) | 7.84% | 14.65% | 22.17% | |
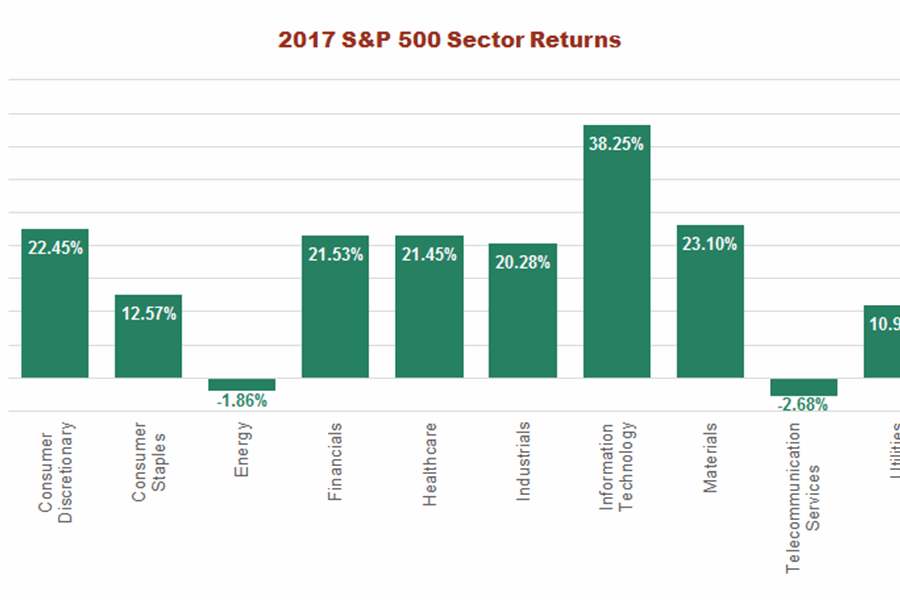
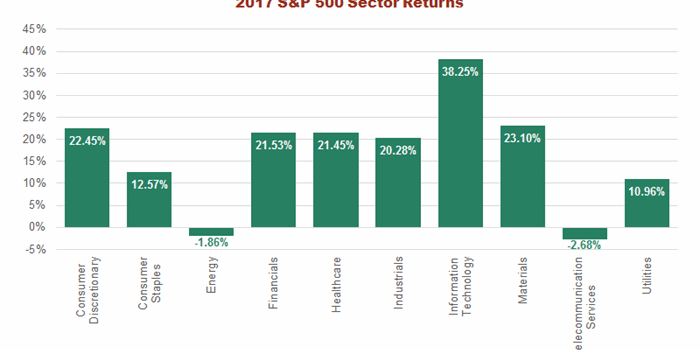
With regard to sector returns, only Energy and Telecom fell. All other sectors posted strong, double-digit results.
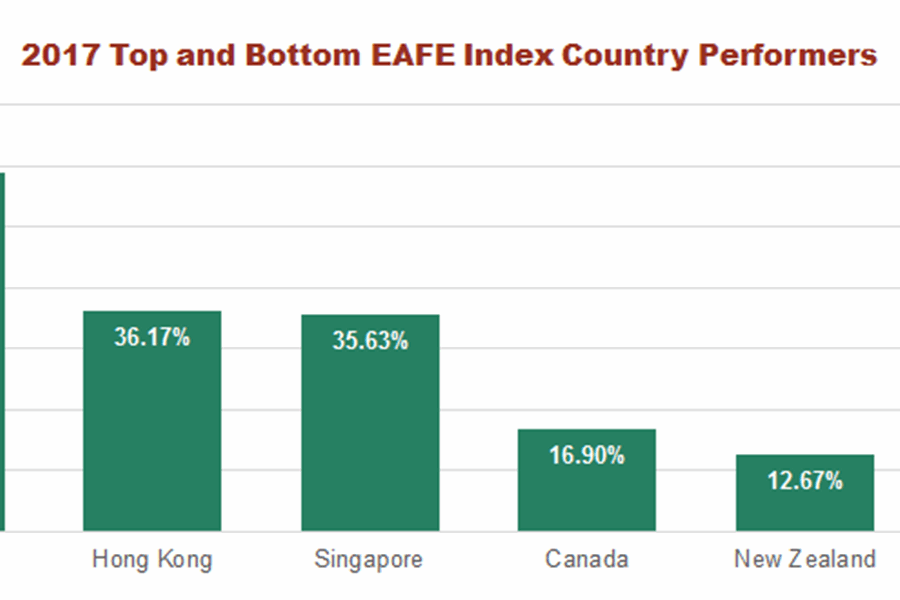
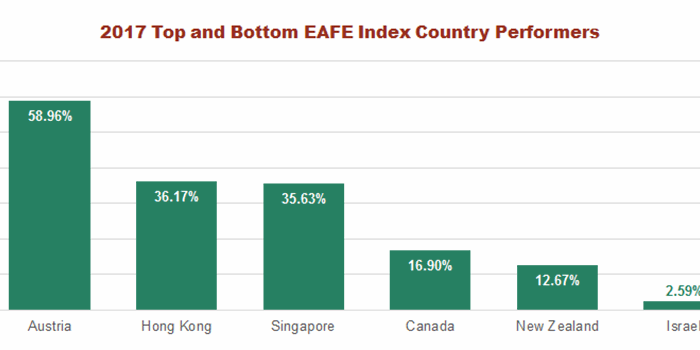
Non-U.S. Developed
Regional and country returns were also strongly positive. In fact, all regions performed within the 22-28% range. With regard to individual market returns, what is most impressive is that even amongst the three countries in the EAFE index with the weakest performance, two of them posted double-digit gains and the “worst” return was still modestly positive.
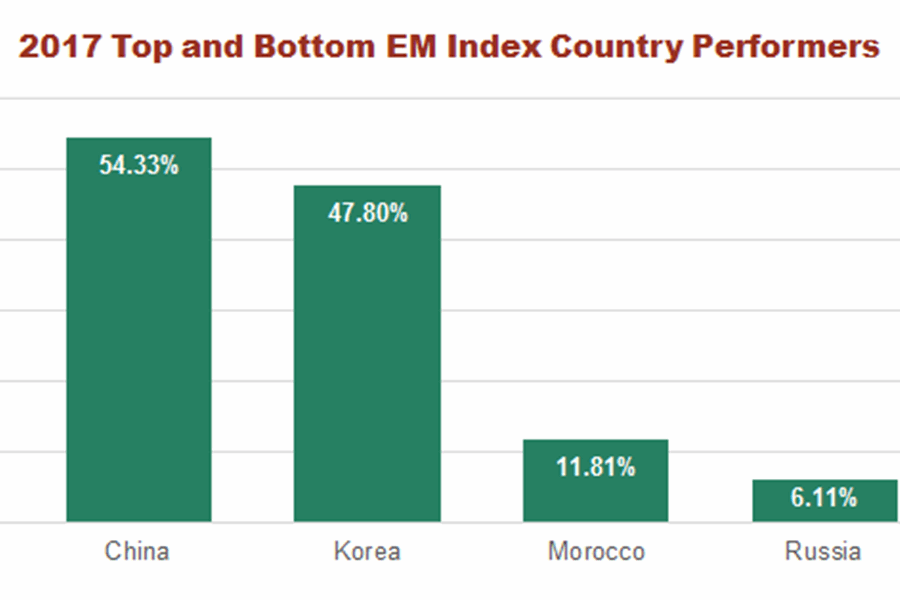
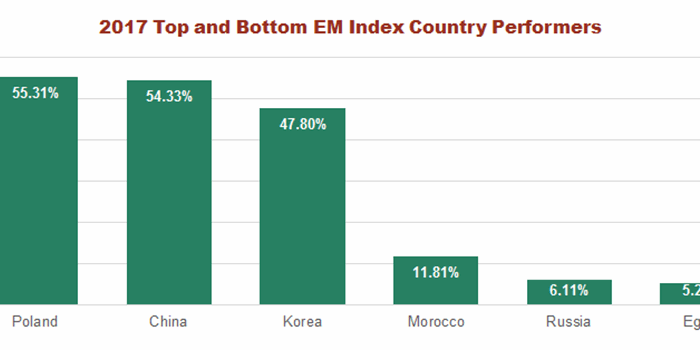
Emerging Markets
On a regional level, EM Asia was the clear winner with a 43.26% return, versus Latin America, Europe and EMEA, which posted returns ranging in the low to mid 20s. On a country level, it was a similar story to non-U.S. developed equities, with the weakest markets still showing a solid performance.
Will the Equity Markets See Outsized Returns in 2018?
Several global trends boosted stock performance last year. Economic growth continued to strengthen in the United States, while global growth showed signs of a sustained pickup. Corporate earnings were solid worldwide. Weakness in the U.S. dollar was a boon to returns in international and emerging markets. With all this positive news, investors shrugged off most bad news related to geopolitics, valuations or other concerns. The VIX, known as the “fear index,” fell to historic lows with investors’ positive feelings in 2017.
Sustaining the global equity bull market will likely be a challenge this year. Segal Marco Advisors will be watching several factors that could influence equities as we enter 2018, such as central banks worldwide planning to pull back on stimulus, valuations creeping higher, and the possibility that earnings growth and consumer confidence may not continue to be so strong. There are also geopolitical risks, as always, that can affect investor sentiment suddenly.
Please stay tuned for our 2018 Investment Outlook, where we will assess the macroeconomic environment and its impact on asset classes and, ultimately, investors’ portfolios.
The information and opinions herein provided by third parties have been obtained from sources believed to be reliable, but accuracy and completeness cannot be guaranteed. This article and the data and analysis herein is intended for general education only and not as investment advice. It is not intended for use as a basis for investment decisions, nor should it be construed as advice designed to meet the needs of any particular investor. On all matters involving legal interpretations and regulatory issues, investors should consult legal counsel.
