Inflation has arguably been the most discussed and debated topic in the financial markets of late. Investors have concerns around the magnitude of inflation, its composition and whether or not it is “transitory,” as the Federal Reserve believes, or here to stay. Adding to the confusion is the complexity of the alphabet soup of abbreviations from the Bureau of Labor Statistics (BLS) and the Bureau of Economic Analysis (BEA) that measure and report inflation: PPI, CPI and PCE.

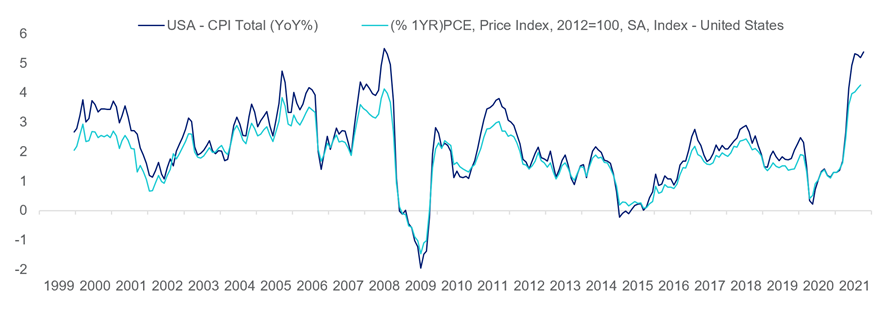
These figures are measured differently and provide different results. For example, since 2000, prices as measured by the CPI (Consumer Price Index) have risen annually at 2.4 percent, compared to just 1.9 percent as measured by PCE (Personal Consumer Expenditures). Compare that to the recent surge in prices over the past year as inflation has far surpassed its historical average, increasing to a rate of 5.4 percent year over year as of September 2021.
CPI and PCE Since 1999
Investors have been taking a closer look at their portfolios to evaluate risk and the impact that higher inflation might have on future returns. However, with so many different metrics and ways of measuring inflation it is important for asset owners to understand the differences and distinctions among the various measurements to determine which ones have a direct impact on their investment program, and then identify ways to position the assets to protect against or profit from impacts of inflation.
Consumer Price Index (CPI)
The CPI, specifically the CPI for All Urban Consumers (CPI-U), is likely the most well-known metric, as it has been around for over a hundred years and is designed to measure price changes of a basket of goods and services used by urban populations. It represents about 93 percent of the U.S. population. This metric captures things like food and beverages, housing, apparel, transportation, medical care and recreation. The weights of each category evolve over time as the BLS accumulates data received in consumer and business surveys.
Difficulties with fielding surveys, aggregating data and calculating the CPI typically means that consumer basket weightings are often based on survey results from up to two to three years prior. Couple that with the capacity for fraudulent responses common with online surveys, and it’s easier to understand why investors analyze inflation using a variety of metrics.
Since the inception of the CPI, the BLS has made structural changes to the calculation, including adjustments for new or improved products and services (e.g., telehealth and grocery delivery services) as well as manipulating the shelter component to exclude the capital investment aspect of home ownership and isolate monthly living expenses.
The CPI has a wide array of applications. Retirement benefits and programs, such as Social Security and pension funds, typically adjust benefits over time to account for inflation as measured by the CPI. Institutions, such as endowments and foundations, typically target a long-term rate of return in excess of the CPI for their investment pools in order to grow the pool to increase the purchasing power of the assets. In the financial markets, TIPS (Treasury Inflation Protected Security) instruments, which are government bonds designed to protect against the harmful impact of inflation, incorporate changes in the CPI in their pricing and coupons. For both individuals and institutions, changes in the CPI can have profound impacts on financial well-being and purchasing power over time.
Personal Consumption Expenditures (PCE)
The Personal Consumption Expenditures index, which is also known as the “PCE Deflator,” is the Federal Reserve’s inflation statistic of choice, which makes it a very important and closely followed metric, especially in the financial markets. The PCE price index uses monthly purchase data to track price changes for goods and services purchased by consumers. Whereas the CPI is based on a fixed basket of consumer goods and services, the PCE reflects real consumer spending, which more accurately accounts for changes in purchase behavior. It also includes government programs and services, such as Medicare and Medicaid, which are excluded from the CPI. With more objectivity built into the calculation of PCE, this metric directly informs and impacts monetary policy decisions, and given how instrumental monetary policy has been for economic growth and financial markets over the past decade, one could argue the PCE is the most relevant inflation gauge.
Producer Price Index
The Producer Price Index (PPI) measures the average change over time in the selling prices received by domestic producers of goods and services. In many ways, this index tracks changes in the prices of things Americans buy every day. It not only measures the impact on daily consumer spending, but also on the changes to input costs facing businesses.
Thus, it should provide a good and reliable gauge of actual inflation. However, there can be some noise in this index because producers may not always pass along higher input prices to consumers, potentially limiting the validity of the metric’s use in the short term.
Key differences
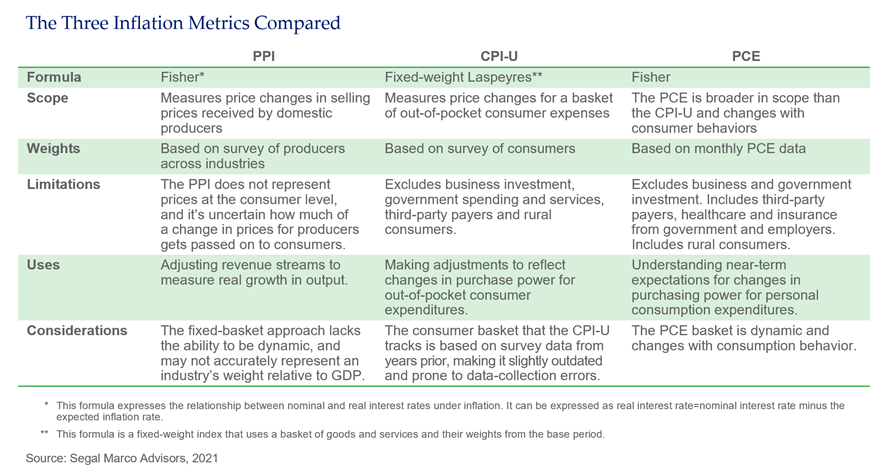
Given the importance of inflation, as discussed above, and recognizing the myriad metrics utilized to measure it, it is important to understand how each is different to determine its relevance. Generally speaking, the primary differences among the various metrics can be attributed to the following:
- The types of “things” they capture (known as scope effect)
- The weights they assign to the various categories (weight effect)
- The actual formulas for calculating the metrics (formula effect)
Looking first at scope effect, there are conceptual differences that distinguish each of the three previously mentioned metrics. The PPI measures how changes in prices impact suppliers. The CPI tracks out-of-pocket household spending. The PCE measures personal sector expenditures, including households and nonprofit institutions. The distinction between the PCE and the CPI is an important one, as the broader scope of the PCE incorporates government services not included in CPI, such as Medicare, Medicaid and employer-sponsored healthcare plans, in both urban and rural areas.
The weight effect, referring to the composition of goods and services included in each metric, also contributes to different results for the PCE and the CPI. As mentioned above, consumer surveys (typically from a couple of years prior) dictate the consumer basket, which doesn’t account for changes in consumer behavior the same way the PCE does. This can be particularly problematic when faced with systemic disruptions, such as the COVID-19 pandemic, that drastically alter spending habits.
Finally, the actual weights placed on each consumption category will impact each metric. For instance, compared to the PCE, the CPI places a larger emphasis on shelter (i.e., owner’s equivalent rent, which is meant to capture homeowners’ best guesses for how much they could charge to rent out their home) and gasoline. Conversely, the PCE incorporates a greater degree of medical goods and services, constituting over 40 percent of the metric, compared to the CPI’s roughly 20 percent weight.
Implications for investors
Because inflation metrics can represent different aspects of inflation, understanding the distinctions is critically important in determining how inflation impacts an investment program. Additional considerations, such as currency exposure and impacts to underlying business operations, as well as benefits or investments directly tied to inflation measures, will also play a role in identifying solutions to protect against potentially harmful effects of inflation.
In subsequent articles, we’ll expand upon the impacts of inflation and explore ways in which investors can review their investment portfolios to better understand and manage within various inflationary environments.
See more insights
The information and opinions herein provided by third parties have been obtained from sources believed to be reliable, but accuracy and completeness cannot be guaranteed. This article and the data and analysis herein is intended for general education only and not as investment advice. It is not intended for use as a basis for investment decisions, nor should it be construed as advice designed to meet the needs of any particular investor. On all matters involving legal interpretations and regulatory issues, investors should consult legal counsel.
