Recently, I was notified that my thirty-year high school reunion was cancelled due to COVID. Being reminded that I graduated high school and started my university career thirty years ago made me nostalgic for the past and thoughtful about how much the world had changed.

The ubiquitous nature of computer spreadsheets is one example of how my daily life has altered. While this technology dates back to the '80s, as a STEM student thirty years ago I seldom remember them incorporated into my studies. I can’t imagine a modern day applied math major not being well-versed in the power of Excel.
It just so happened that this trip down memory lane coincided with an analysis of Treasury debt issuance in 2020 as a response to the pandemic. A curiosity arose; a Treasury STRIP bond that matured this past August was issued when I began college thirty years ago. What type of yield could you have locked in for three decades at very limited default risk and no reinvestment risk?
The answer is a yield of 8.75 percent compounded semi-annually. In finance, the so-called "rule of 72" is a way to figure out how long an investment will take to double with a fixed rate of annual interest. The rule of 72 indicates that with a yield of 8.75 percent, money doubles about every eight years. Your $100 investment in that bond would double almost four times during its investment horizon! In other words, my $100K investment in a degree would have grown to about $1.6 million with little uncertainty.
A question immediately struck me — what performed better over the last thirty years, a $1 investment in the S&P 500 with dividends reinvested or this boring Treasury bond with no (nominal) risk?
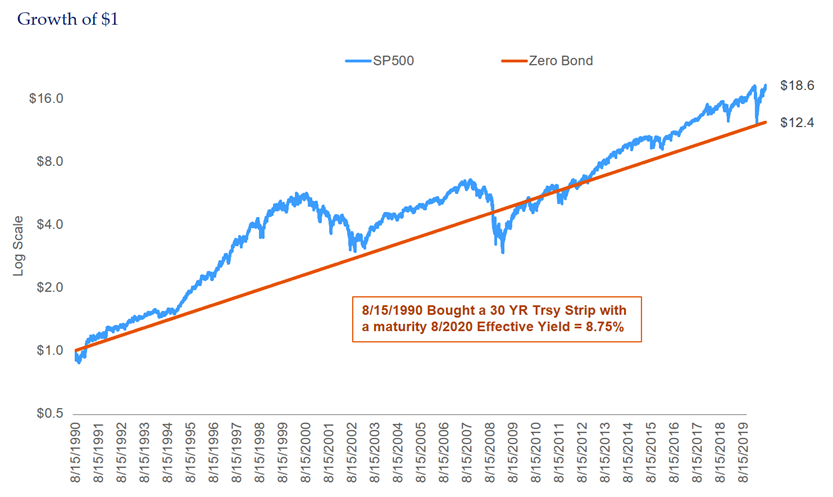
The S&P 500 is the long-term winner, adding about 1.25 percent additional annual rate of return at around 10 percent per annum. During most of the thirty years, equities were in the lead, although for a period after the Great Financial Crisis they relinquished the advantage. It is amazing to note that for a day in 2020, at the peak pandemic sell-off, the zero’s rates of return broke about even with stocks after three decades.
That chart above is a bit of an "apples and oranges" comparison as the 30-Year STRIP is valued at book value. In the chart below, we have valued the STRIP marked-to-market (MTM.) As we're all aware, during the past thirty years Treasury yields have rallied, which is accretive to bond prices.
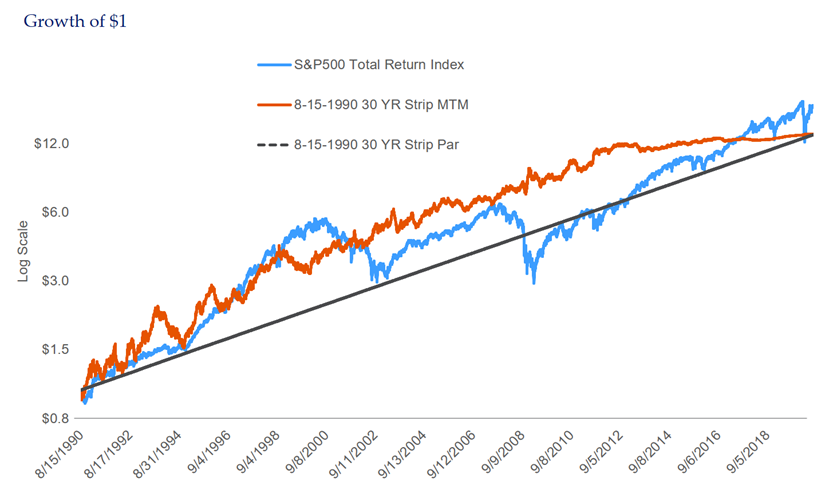
Now the horse race has changed. For a long period, that boring bond outperformed the S&P 500 — stocks for the really long-term! Note that the market value of the bond continued to grow across both the dot-com bear market and the Great Financial Crisis, a diversifier as well!
You may be asking, are we recommending investors pile into the "thirty-year" STRIP today? While learning from the past is critical to human development, navigating your portfolio by looking through the rear view mirror is extremely hazardous — please, for your participants’ own good, throw away those rolling thirty-year historical charts.
Let’s use the May 2020 30 Year Zero for the indicator of the next thirty years.
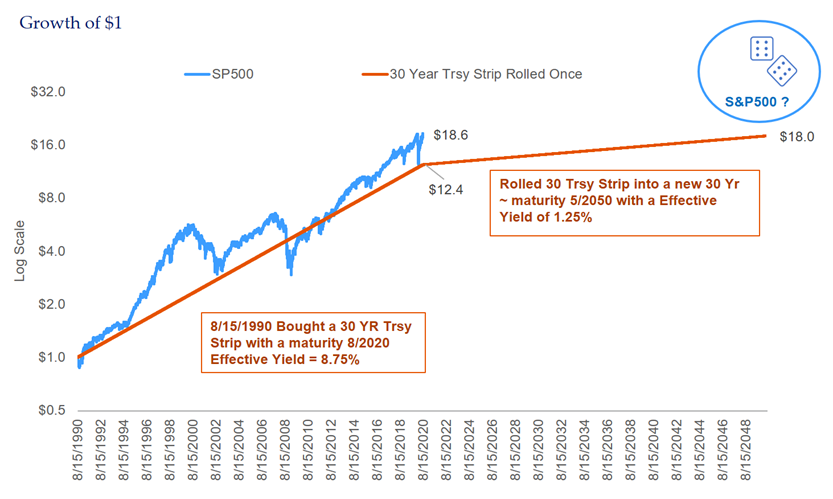
Wow, talk about hockey sticks; times have really changed. The effective yield for the just-issued thirty-year STRIP was a meager 1.25 percent. From nearly four "doubles" in the past, today your future 30-year investment will lock in a miserly 45 percent accumulation.
To be clear, that kind of accumulation is in nominal terms — i.e. returns before taxes, fees, and inflation. If the Fed achieves its modest inflation target of 2.0 percent per annum, in 2050 that zero coupon bond would you a loaf of bread only 80 percent the size of one today. By the way, the CPI-U (the consumer price index for all urban consumers) averaged 2.3 percent over the past three decades. If we run a little "hot" in the future at a 4.0 percent inflation rate, surely a contentious scenario beyond the scope of this piece, your bread ration is down by over half. To be fair, many institutional investors have promises far into the future with no inflation indexing so this risk goes away. On the bond side, our three-decade future (nominal) return has as much certainty as you can obtain in the financial markets and maybe life in general (death and taxes.) For US equities, it is tempting to splice the 100 years of quality data we have into little bits and run a bunch of rolling horizon analyses in the quest for statistical "certainty." The cold hard reality is we don't have enough data to make any pronouncements of certainty for the stock market. Nevertheless, we found a few historical anecdotes intriguing.
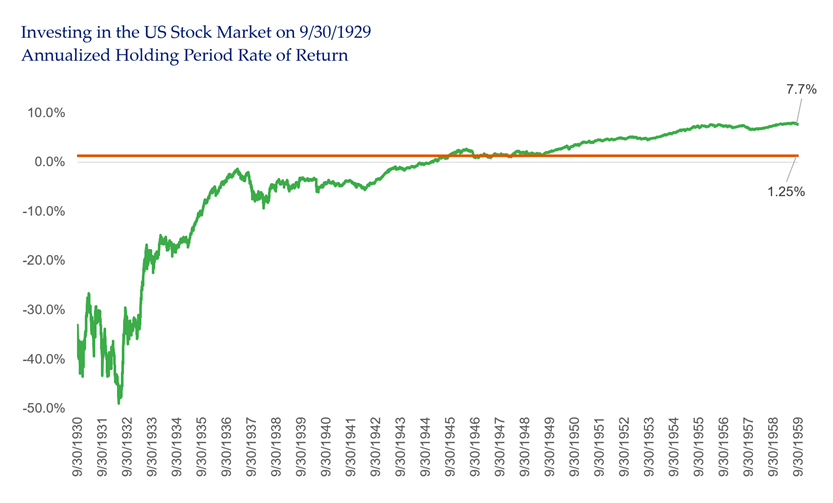
Assuming you had a misfortune to put all your savings into the roaring U.S. stock market on the last day of September 1929, your three decade annualized rate of return (assuming dividends reinvested) was between 7-8 percent. You broke even with a 1.25 percent hurdle rate in 1947, seventeen years later after a devastating start (and a successful world war.)
However, we'd be remiss if we did not point out another more recent example — the infamous Japanese stock market bubble of the 1990s. As 2019 ended, we had a very disappointing three decades of performance for an investor in Japanese stocks. The historical rate of return fell short of 1.25 percent with a -0.3 percent annualized rate of return (TOPIX priced in yen with dividends reinvested.)
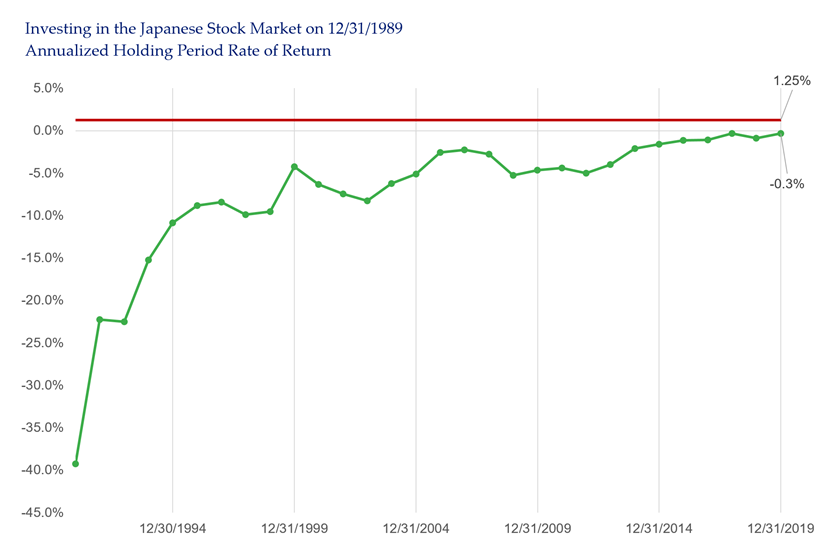
While the over/under decision in 1990 required some thought (and was a close race), today it's difficult to not take the over and go with equities at a "zero coupon" hurdle rate just north of 1 percent.
Unfortunately, when this race finishes, instead of 48 I’ll be 78 and I’m not sure what I’ll be using the equity wealth for, as most of my time will be spent complaining about the weather and the youth of the day.
The information and opinions herein provided by third parties have been obtained from sources believed to be reliable, but accuracy and completeness cannot be guaranteed. This article and the data and analysis herein is intended for general education only and not as investment advice. It is not intended for use as a basis for investment decisions, nor should it be construed as advice designed to meet the needs of any particular investor. On all matters involving legal interpretations and regulatory issues, investors should consult legal counsel.
