As the COVID-19 pandemic continues into 2021, there is still much uncertainty as to the longer-term impact on real estate markets. While the impact has been widespread, certain sectors and markets have been harder hit than others due to shelter-at-home policies, economic disruptions and ensuing job losses.

The COVID-19 pandemic has not only exacerbated trends that were already in place (such as the growth of e-commerce) but has turned existing trends on their head (office densification, for example.) It’s also created newer trends (such as working from home, increased demand for suburban residential) — the extent and duration of which are still unknown.
Versus the global financial crisis, the COVID-induced recession is expected to be more short-lived with less impact to property values as a whole. Real estate fundamentals were much stronger going into this recession. Many property owners, conscious that it was late in the cycle, had reduced leverage and had assumed a more defensive positioning. Additionally, with the exception of a couple of overbuilt pockets on the multifamily side, supply for the most part was not an issue. The lending market was also in a stronger position this time around. We have only started to emerge from the shutdowns and shelter-at-home policies that brought the transaction market to an abrupt halt in March. Overall, according to Real Capital Analytics, transaction volumes declined 57 percent year-over-year as of September and current deal volumes remain well below pre-COVID levels. Firm closures and job losses have resulted in lost revenue and incomes for tenants, impeding their ability to pay rent. Value-add and development projects stalled and leasing activity collapsed. While the lifting of some of these restrictions helped alleviate the damage to some extent, increasing infection rates are resulting in localized lockdowns, and putting further pressure on property owners, particularly in the retail and lodging sectors.
In terms of those sectors, both retail and lodging have felt the most immediate impact and suffered the biggest declines. The outlook for both sectors remains challenging over the near term. Other property types, such as industrial and apartments, have been more resilient. Valuations for the most part have held up, particularly for industrial. Apartments have seen some rent pressure and concessions have become the norm in some urban areas as landlords battle to attract renters. The big question is office and to what extent office workers will continue to work from home. Long-term leases have supported office valuations; however, the outlook is less certain as lease roll-off increases throughout 2021 and beyond. Will the need for greater space due to COVID requirements help offset the loss of remote workers? Interestingly, niche sectors such as life sciences, data centers, cold storage and self-storage have been relatively strong performers, while medical office, senior living and student housing have recovered to some extent after an initial pull-back. Outside retail and lodging, there is little evidence yet of a widespread “COVID discount” due to limited transaction volume. As such, fund managers are adjusting valuations as they see fit and on a case-by-case basis. Conversely, there is even some talk of a “COVID premium” for industrial assets.
General Observations
Overall, the impact to private real estate as a whole has not been as bad as initially expected, with the exception of some sectors such as retail and lodging, which have been disproportionately affected. However, despite vaccines providing hope for an end to the pandemic as well as government stimulus/intervention, much uncertainty remains as to its duration and the shape of the recovery. Softening fundamentals are starting to impact property pricing.
Looking ahead we expect:
- A continued rotation out of office and retail to multifamily, industrial and non-core property types such as medical office and self-storage
- A move away from gateway markets (both people and businesses) to more growth-oriented markets in the South that offer residents a better standard of living
- A focus on suburban over urban as older millennials move out from the cities to the suburbs to start families. Work from home (WFH) and work-from-anywhere (WFA) policies further facilitating this move to the suburbs.
- Extended consequences on pricing and demand on core funds. Broadly speaking, most core funds tend to have a strong focus on gateway markets as these markets have tended to be very liquid and less likely to suffer demand shocks. They have also tended to be more resilient during a crisis. That has not been the case during this downturn. High taxes and high cost of living in gateway markets had already been pushing people out to cities that could offer a better standard of living. COVID-19 has exacerbated this trend.
- Continued uncertainty in the office sector. Majority of core funds tend to have significant exposure to office — approximately 34 percent of the ODCE Index as of Q3. Retail exposure in the ODCE is 14.8 percent with individual funds ranging from a low of 7 percent (TA Realty) to a high of 23 percent (JP Morgan’s Strategic Property Fund); however, it should be noted that some retail such as neighborhood centers and grocery-anchored retail is doing fine.
Other observations to consider in 2021:
- Significant dry powder — strong investor demand for multifamily and industrial as well as niche property types such as life sciences, medical office and self-storage.
- The real estate recovery will lag the economic recovery by several quarters, although worldwide economies are expected to recover in 2021 (with timing dependent on the rollout of vaccines).
- The ultra-low interest rate environment is set to continue for some time and should provide a positive backdrop for increased interest in income generating assets, such as core real estate.
- Limited distressed private equity transactions to-date as forbearance on loans allowing borrowers to hold on to assets; however, forbearance is coming to an end and as a result distressed sales are anticipated to pick up significantly in 2021, with a significant disparity in bid-ask spread for current deals providing a backdrop on pricing.
- Trepp CMBS Research reports fastest rise in delinquency rates in CMBS history, hitting a near all-time high of 10.32 percent in June 2020. A surge in lodging (24.3 percent) and retail (18.07 percent) are the driving force behind the increase. (CMBS loans are typically the first to go delinquent as they tend to be difficult to renegotiate).
Performance
- While the economic impact of COVID was quickly evident in the REIT market, the private real estate market has been much slower to react, as private real estate values typically lag the economy.
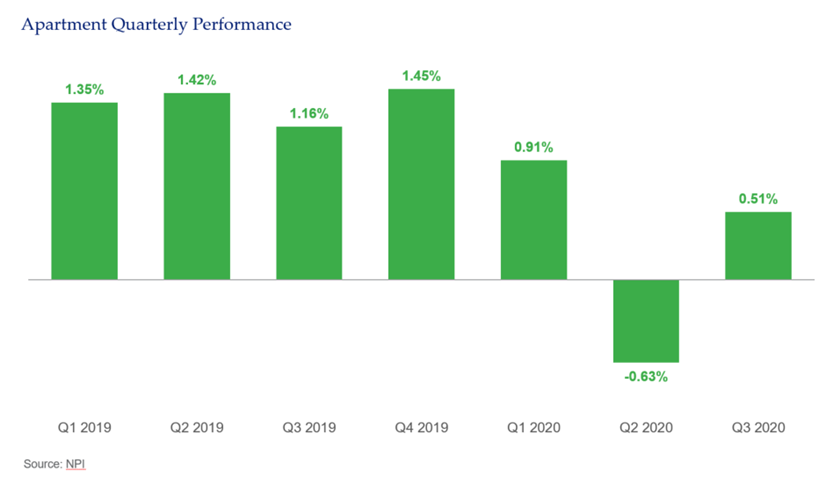
- The NCREIF ODCE Index returned a slight 0.11 percent loss year-to-date comprised of 2.26 percent income and 2.96 percent negative appreciation as of September 2020. While Q1 returned a slight 0.9 percent gain, the impact of COVID was most evident in the second quarter with downward valuation adjustments resulting in -2.46 percent appreciation and a more anemic income return of 0.91 percent, leading to an overall loss of 1.6 percent. Valuation adjustments in the third quarter were a more modest -0.46 percent, resulting in an overall 0.48 percent return for the three-month period. Overall, at this point, the impact to commercial real estate as a whole has not been as bad as initially anticipated. However, much uncertainty remains as to the duration of the pandemic, continued government stimulus/intervention and the shape of the recovery. While the immediate impact on real estate rental collections has been less than initially feared (other than lodging and retail), the longer-term impact remains uncertain and will be very much dependent on how prolonged the downturn is, how the urban flight develops and other stimulus and regulatory relief measures.

- Overall, for the ODCE, income returns have held up well. Rent collections have proven resilient with three of the four core sectors reporting collections in excess of 90 percent.
- Longer-term leases protecting some property types for now, such as office
- Other than multifamily (Class A) in certain markets, oversupply is not an issue
- However, macroeconomic factors are starting to impact real estate fundamentals, leading to increased vacancies across certain property types.
- The surge in infections during the third and fourth quarters and reinstatement of government restrictions at a local level has dampened performance expectations for many sectors for early 2021; however, the successful rollout of the vaccination program will boost economic and real estate recovery.
- While private real estate returns lag the market, it is interesting to see how public markets have repriced property sectors. Since January, core sectors such as office, retail, and multifamily have fallen 20 to 40 percent as per the NAREIT Equity Index. This compares to modest gains for offices and apartments held in core funds and a more moderate loss of 6.4 percent for retail properties.

CORE Fund Redemptions
- Similar to the GFC, redemption requests have increased significantly resulting in temporary gates and adjustments to redemption policies. The disruption to transaction markets and uncertainty surrounding COVID has made it more difficult for funds to pay down redemptions. As such, it is difficult for many managers to ascertain the length of time it will take to either pay down requests or, alternatively, call capital.
- As of September, there was $19.2B in outstanding redemption requests for core ODCE funds (data for 22 of the 25 funds). This represented 9.7 percent of the total NAV across all 22 funds measured. Four funds accounted for almost 70 percent of total ODCE redemptions – UBS Trumbull Property Fund ($8.1B), JP Morgan Strategic Property ($3.143B), Clarion Lion Properties Fund ($1.15B) and BGO Diversified US Property Fund ($1.0B).
- Redemptions ranged from a low of 0 percent of NAV to a high of 54.37 percent (Trumbull Property Fund).
- Of the 22 ODCE funds analyzed, only two funds, Goldman Sach’s US Real Property Income Fund and Blackrock’s US Core Property Fund, reported no redemption queue as of Q3 and no uptick in redemption requests related to COVID. Additionally, while not part of the ODCE, Kayne Anderson’s core fund, which focuses on medical office and senior living, has no redemption queue and nor did it experience an uptick in redemption requests. They are, however, seeing more interest from investors wanting to put money into these niche property types.
- While redemptions are on the high side, it is worth noting that during the GFC core funds also experienced significant redemption requests; however, approximately 40 percent of these were subsequently rescinded.
Notably, there was $4.5B in investment queues across 14 of the 22 funds, 70 percent of which was concentrated across four funds (Principal US Property Account $955.5M, Morgan Stanley Prime $892, PGIM PRISA $643.3M and CBRE $635M). Some funds have reported an uptick in interest in the last few months.
Transaction Activity
- COVID-19 and ensuing shelter-at-home policies brought about a severe halt to the real estate transaction market. According to Real Capital Analytics, transaction volume for commercial real estate plummeted 71 percent in April to a modest $11 billion. However, while transaction levels remain muted versus historic levels, Q2 did experience a recovery of sorts coinciding with the easing of quarantine restrictions in many states. Since then, deal activity has continued to pick up; however, there is still a distinct lack of price discovery in some sectors.
- While many industry experts felt that real estate markets were fully priced before COVID, the opportunity now exists to take advantage of the repricing that has started to occur, albeit at a relatively slow pace. Bid-ask spreads remain wide today; however, the expectation is that as owners become more distressed we will start to see an increase in assets entering the market at attractive valuations. Currently, borrowers are benefiting from lender forbearance; however, that cannot last forever.
- According to Real Capital Analytics, the dollar volume of transactions trading hands in Q3 was down 57 percent from a year prior; however, it is up 37 percent on Q2 levels.
- There is significant capital available for industrial and multifamily assets and not surprisingly they lead the way in terms of investment activity. Due to strong performance, robust fundamentals and high levels of investment activity, the industrial sector is experiencing increasing upward pressure on pricing.
- Office transaction activity was down 60 percent year-on-year largely due to uncertainties stemming from working from home.
- According to managers, many office property sales failed to transact with most of the activity taking place in the more growth-oriented markets of the South.
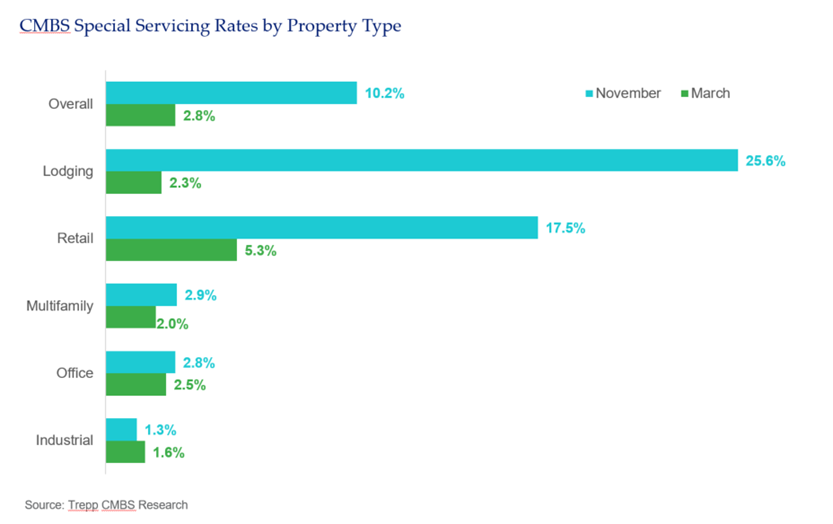
- As of yet, there have been limited distressed sales with distressed sales representing only one percent of all sales activity. Distressed sales as a percentage of total sales was higher for the retail (3 percent of all deal volume) and hotel (9 percent of all deal volume) sectors. There is no doubt, however, that the distress is coming. CMBS Special Servicing rates have increased at the fastest pace ever, increasing from 2.27 percent in March to 10.2 percent in November. According to Trepp, it took much longer for CMBS delinquencies and special servicer rates to reach their peak during the GFC, starting in 2008 and not reaching their respective peaks of 10.34 percent and 13.36 percent until mid-2012. (The special servicing rate is thought to be a better measure of the distress in the market versus the delinquency rate because if a loan goes into forbearance it switches to “current" status from delinquent; however if stressed it continues to be specially serviced).
- As of November, there was a total of $59.9 billion of loans in special servicing, an increase from March of $40.6 billion.
- Retail ($16.2 billion) and lodging ($21.3 billion) loans represented 92.3 percent of the $40.6 billion of new loans in special servicing. (Source: Trepp and Starwood).
Property Sector Highlights
- Office: One of the biggest uncertainties stemming from COVID is how far-reaching and permanent the WFH or WHA shift will be. Some key companies, like Google, Twitter and Facebook, have already announced plans to instigate remote working policies indefinitely, reducing their office space requirements. It is too early to say what the impact on longer-term office demand will be.
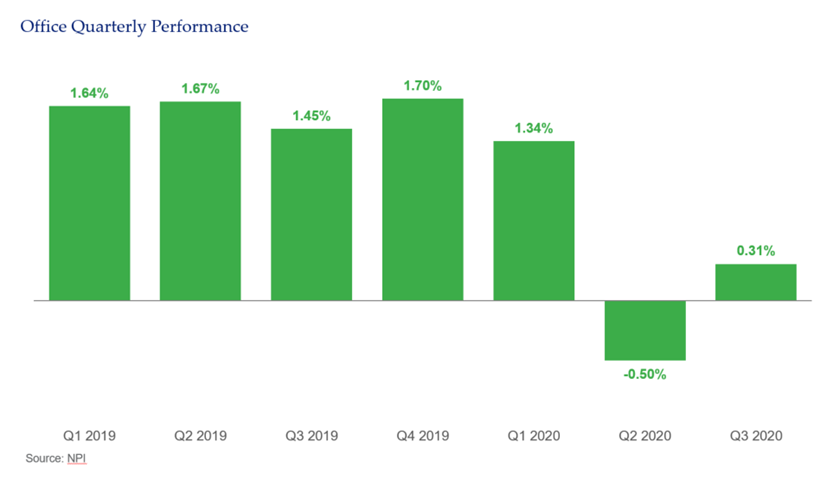
- Year-to-date, the office sector, as per the ODCE Index, was up 1.15 percent with long-term leases helping to support values. This compares to the NAREIT Equity Index’s 28.5 percent loss for the same time period (ending September 30th).
- Overall, rent collections for ODCE properties have generally been strong, remaining above 90 percent. However, longer-term leases are currently protecting office valuations.
- Notably, since March, the amount of office sub-lease space has increased significantly in key markets, reflecting companies’ needs to reduce their office space requirements. As per CBRE, the share of sublease space in total office availability exceeded 25 percent. According to the RealDeal, Manhattan’s office market saw an increase in sublease space from 2 percent to 12 percent from March to July. In Chicago, it rose from 8 percent to 24 percent and in LA from 28 percent to 42 percent over the same period. Space is typically sub-leased at a significant discount from the original lease agreement, particularly at the latter end of the lease, so as the amount of sublease space grows it can negatively impact pricing. A recent sublease space at 245 Park Avenue went for $25/sq. ft., an approximate 70 percent markdown on the building’s average price; however, the average discount as of September was about 25 percent. On a national level, sublease space increased to a record 156 million square feet, representing 13 percent of total available office space at the end of September. (TA Realty)
- According to CBRE, there is now 13 million square feet of available sublease space in Manhattan. During the GFC, Manhattan sublease space increased from 6.3 million square feet in 2007 to 10 million in 2009 with the average asking rent for direct space declining by 24 percent over the same period.
- Very little transaction activity is occurring in the office space, making it more difficult to assess values. Most transactions occurred in growth-oriented Southern markets. A number of deals in gateway markets have failed to close.
- Demand for more creative office space, growing interest in suburban office and increased demand for flexible office space is increasing. Landlords are adapting to the new reality offering shorter, more flexible lease terms, redesigning office layouts to account for social distancing, and working to increase the overall “wellness” of the building by upgrading air filters and implementing other safeguards.
- Greenstreet estimates that office demand will fall by 10-15 percent due to permanent WFH policies. This appears to be the general consensus from managers.
- The Netherlands, which has an extremely flexible work culture, had 14.1 percent of its workforce work from home pre-COVID (BBC). Amsterdam, which has encouraged WFH for environmental reasons, had approximately 17 percent of its workforce switch to working from home pre-COVID. (Source: Hines)
- De-densification within offices should counteract some of the reduced demand from WFH.
- Industrial: Year-to-date, the industrial sector has been the best-performing sector in the ODCE with stronger fundamentals than any other property type. The sector had already been doing very well pre-COVID, outperforming all other sectors in the ODCE index. Ecommerce has helped boost industrial demand. For example, Amazon is expected to increase its U.S. industrial space by 40 percent in 2020 to 241 million square feet. According to Statista, Amazon is projected to represent 47 percent of all retail ecommerce in the U.S. by the end of 2020.
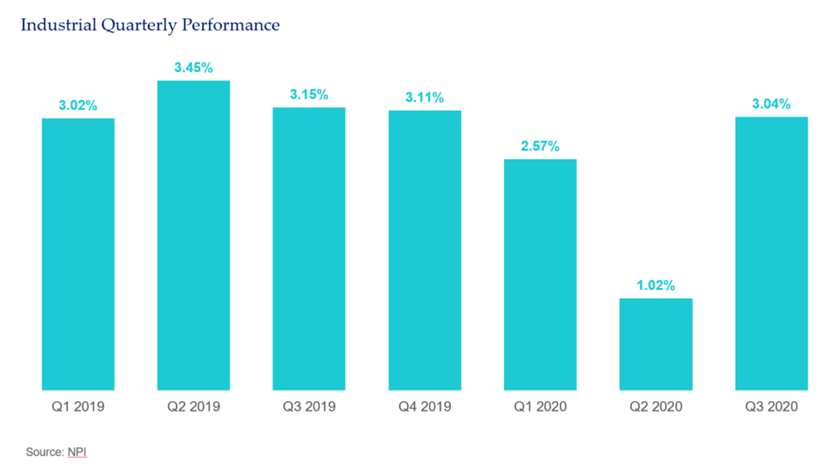
- Long considered a more defensive property type, the industrial sector has shown its resilience during the downturn with a 6.64 percent gain for nine months ending September. Public market performance has also been strong, relative to other sectors.
- Many markets experienced stronger than expected rent growth — in particular, Nashville, Phoenix and Atlanta.
- Generally, there is a shortage in the type of industrial assets required to support the growth in ecommerce. In particular, there is very strong demand for last-mile logistics infrastructure. Industrial development remains an attractive strategy for now.
- Record levels of leasing activity were reported in the third quarter. Amazon continues to make headlines but represents only 10 percent of all leasing activity since March.
- Strong investor demand for the property type will push up pricing.
- Growth of sub-sectors such as cold storage and logistics are expected.
- The industrial sector is expected to continue to perform well over the near-term.
- Retail: Pre-COVID, retail, a sector that has long been considered “overbuilt,” was already suffering the effects of increased online shopping. COVID-19 accelerated that trend, with online shopping increasing from 11.1 percent in Q3 2019 to 14.3 percent in Q3 2020, according to Statista. With the exception of necessity retail and well-located neighborhood centers, most other retail sub-sectors were heavily impacted by COVID and experienced significant write-downs in the second quarter.
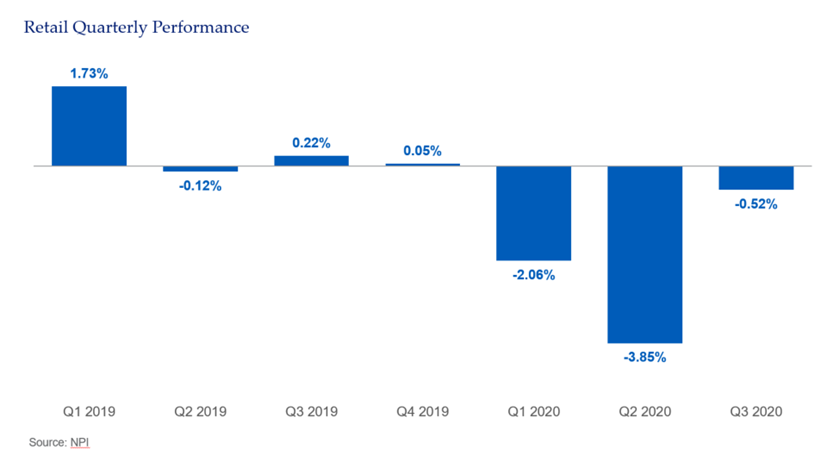
- The retail sector fell 6.4 percent in the first nine months of the year as per the ODCE Index with all three quarters reporting negative results. The EPRA NAREIT Retail Index was down 39.5 percent for the same period.
- Regional malls and super-regional malls were the worst hit, down 11.1 percent and 14.1 percent, respectively, for ODCE’s trailing one-year returns.
- Pre-COVID, many malls had reinvented themselves as lifestyle centers in order to attract footfall; however, facilities such as gyms, restaurants, movie theatres, etc. were also subject to closures.
- A growing number of retail bankruptcies including well-known names such as Neiman Marcus, J. Crew, JC Penny, Gold’s Gym, CMX Cinemas, Dean & Deluca and Lord & Taylor resulted in further dislocation to retail. Interestingly, or perhaps creatively, large property owners are seeking to limit downside by purchasing retail tenants. Mall owner Simon Properties purchased Brooks Brothers and Lucky Brands in conjunction with Authentic Brands, which it had acquired with Brookfield Property Partners in 2016, adding to its retail ownership, which includes Aeropostale and Forever 21.
- Retail reinvention is an emerging strategy post-COVID — the conversion of retail outlets to other uses, such as residential or industrial, is an increasingly viable strategy. However it can be risky, costly and in some cases difficult to get approval.
- Brick-and-mortar retail outlets are expected to recover in 2021, assuming the successful rollout of a vaccine. Significant pent-up demand should boost retail sales, particularly for the service sector.
- CBRE predicts a 20 percent reduction in total U.S. retail square footage by 2025 from the current 56 sq. feet per capita.
- Multifamily: Multifamily as a whole has held up well during the recession; however, there are pockets of concern and some sub-sectors/markets are proving more resilient than others. As the pandemic continues to surge into the fourth quarter and localized restrictions are re-imposed, further job losses could be forthcoming. The unemployment rate has been trending down every month since its 14.7 percent April peak, reaching a post-COVID low of 6.7 percent. (In the months preceding COVID, the unemployment rate was trending between 3.5 percent and 3.6 percent, one of the lowest rates on record post-World War II). The federal moratorium on evictions was due to end on December 31, 2020 and is now scheduled to be extended through March 2021. This will continue to support tenants that are in hardship due to COVID. According to the U.S. Census Bureau’s Household Pulse Survey, approximately nine million households were in arrears on rent as of November 9, representing roughly 18 percent of all renter-occupied units in the country.
- Class A apartments have been the hardest hit sub-sector to date, particularly assets in gateway markets, due to the ongoing delivery of new supply, young workers moving home and the continued shift to more affordable alternatives. As a result, vacancy rates have increased and concessions are commonplace. Additionally, we are starting to see more delinquencies, particularly in markets hit with significant new deliveries.
- Significant new supply scheduled for 2021 delivery will delay Class A recovery in certain markets.
- Workforce housing (which caters to middle-income earners: those that earn between 60 percent and 120 percent of the area median income, often including Class B and C properties) has proven much more resilient. Very little new supply over last few years due to high costs of construction and resources. Lower vacancy rates versus Class A properties.
- Affordable housing, which is subsidized by the government, is most at risk from job losses due to COVID (service industries, temporary jobs). Reports were of rent collections dropping to 75 percent in some areas. Further job losses will exacerbate the situation. The sector is very undersupplied, with the National Low Income Housing Coalition (NLIHC) estimating a shortage of 7 million homes. Government subsidies are essential in order to make these assets attractive for developers.
- Shift in residential demand from urban centers to the suburbs. Suburban demand is set to increase as millennials, now entering their thirties, move from urban centers to the suburbs in order to raise families in more spacious accommodations and proximity to good schools. COVID-related closures and greater adoption of WFH/WFA policies have reduced the benefits of urban living, resulting in increased tenant demand for more spacious garden-style suburban apartments.
- According to TA Realty, as of Q3, vacancies for downtown multifamily properties are at the highest level recorded while vacancies in suburban markets are relatively lower. Rents for downtown assets fell by 6 percent from the March peak while suburban rents are trending above pre-COVID levels.
- Going forward, more flexible working arrangements (expected to result from COVID) may mean that workers do not need to be in the office five days a week, making longer commutes from the suburbs more tolerable.
- The single-family rental market is also benefiting from the urban to suburban shift. As of June 2020, the single-family rental sector reported year-over-year rental growth of 1.4 percent (CoreLogic).
- While many gateway urban markets grapple with increased vacancies and concessions, other markets in the Sunbelt and Midwest are experiencing increased demand and rent growth. Some of the increase in urban vacancy rates may be temporary as renters relocate to less dense areas to sit out the pandemic.
- There is growing institutional investor interest in niche residential sectors such as active-adult, affordable housing and single-family rental.
- Hotels: The impact to the hotel sector was immediate and brutal. Shelter-at-home policies and travel restrictions resulted in significant hotel closures across the United States while those remaining open operated at anemic capacity. A lifting of restrictions in the second quarter resulted in an uptick in demand; however, the relief was short-lived due to further localized imposed restrictions.
- Private real estate fell 23 percent versus the 49.5 percent decline for hotel REITs for the three quarters ending September 2020.
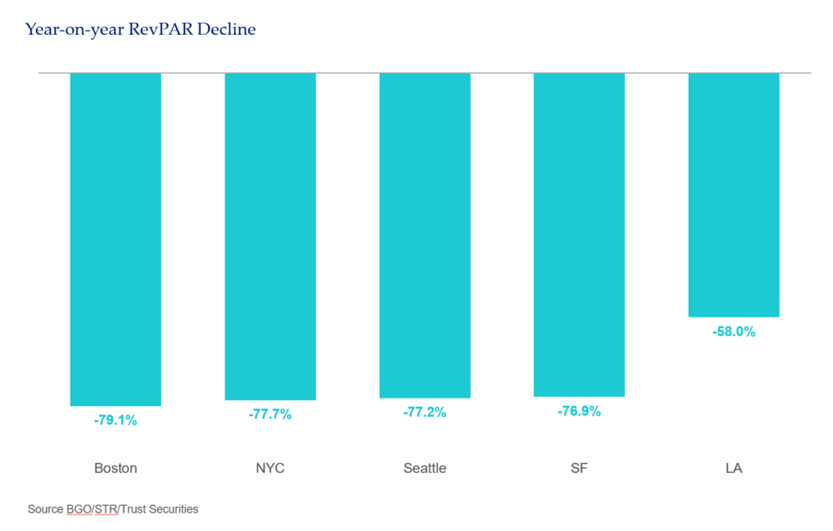
- As of October, nationwide occupancy and RevPAR (revenue per available room) were down 30 percent and 49 percent year-over-year, respectively. This follows an uptick in demand as restrictions were lifted. (Angelo Gordon, STR October Preliminary Monthly U.S. Lodging Data)
- Many hotel operators have tried to repurpose hotels in efforts to remain open. For example, converting to student housing, WFA or shelters for the homeless or frontline workers.
- All lodging sub-sectors have been significantly impacted but properties focused on business travel, convention/group and international demand have been hardest hit. Conversely, drive-to destinations, midscale and economy are faring better.
- According to Lodging Econometrics, there were 1,113 distressed assets across the U.S. at the end of September, accounting for approximately 187,000 rooms. Upper-upscale, upscale and upper mid-scale account for 81 percent of distressed hotel assets. Of the 1,113, 560 are considered severely distressed, meaning that they are in special servicing, receivership or bankruptcy, a foreclosure has been filed, they are lender-owned or an auction date has been scheduled.
- Some distressed sales are already coming to market, mainly luxury or business-focused hotels, but with significant disparity between the bid/ask spreads in most cases. One notable sale is Ashford Hospitality Trust’s sale of newly purchased Embassy Suites near Times Square to Magna Hospitality Group at a 41 percent discount.
- According to Trepp CMBS Research, the lodging special servicing rate peaked in September at 26.04 percent, the highest reported on record.
- The largest delinquent CMBS deal is the $768m loan backing Colony Capital’s Tharaldson hotel portfolio, which was more than 90 days overdue, followed by a $329 million loan backing Thor Equities’ Palmer House Hilton in Chicago, which foreclosed in August.
- In New York city alone, 34 percent of hotels are considered delinquent (CNBC). Notable permanent closures include the 44-story Hilton Times Square (478 rooms) and the Omni Berkshire Place (399 rooms) in midtown Manhattan.
- Pre-COVID, many industry experts believed that there were too many hotel rooms in NYC following significant hotel deliveries over the last couple of years.
- Hotel distress is widespread across all four regions of the U.S., with NYC, LA, San Francisco and Chicago all reporting significant distress from the unprecedented drop in tourist and business travel. The Luxe Rodeo Drive Hotel in Beverly Hills, having just completed a full renovation pre-COVID, has also closed for good. Forecasters believe that over 20 percent of existing supply will close permanently.
- Opportunistic funds are ready to capitalize on the distress. A number of new funds coming to market are focused purely on this sector, where they see an opportunity to buy at a distressed price and hold for recovery, or looking to purchase at a discount and convert to alternate uses.
- CBRE expects this sector to recover in second half of 2021 on the back of a successful vaccination rollout. CBRE Hotels Research forecasts average national occupancy of 44.4 percent for the first half of 2021, increasing to 55.7 percent for the remaining six months. However, the sector is not expected to return to 2019 occupancy, average daily room rate and RevPAR until late 2023 or 2024 at the earliest. (Sources: CBRE, McKinsey)
- Student Housing: The impact has not been as severe as initially expected. In fact, in most markets, student housing has remained relatively strong. Students have shown a strong preference to be close to campus, rather than home with their families, regardless if courses are virtually delivered or not.
- While COVID delayed preleasing, actual leasing was very much on par with, or above in some cases, 2019 levels for well-positioned assets.
- Overall, occupancy levels outperformed expectations for fall 2020.
- Transaction activity has stalled and little debt financing is available. That should reverse quickly when universities fully reopen.
- Facilities catering to universities that typically have high concentrations of international students have generally underperformed.
- Senior Living: Senior housing has been one of the sectors most impacted by COVID. The sector had been in a relatively strong position pre-COVID with supply/demand fundamentals generally in balance. Senior housing has been a “hot spot” for COVID outbreaks and has gotten some negative press; however, facilities with strong operators have generally fared better and were quick to implement practices to stem the spread of the virus.
- Operating costs have increased due to PPE requirements, higher labor costs and technology improvements while revenues are under threat due to falling occupancies.
- Many operators halted move-ins completely, which resulted in higher vacancy rates. Also, prospective residents have been reluctant to move into homes that were not allowing visitors.
- The situation should improve with the rollout of the vaccination program – facilities can reestablish property tours and ramp up move-ins and there is evidence of significant pent-up resident demand.
- Higher unemployment rates will make it easier to hire and keep staff. Wage pressures should also improve.
- Construction starts have dropped materially. According to AEW, new starts are at about one third of the pace of year-ago levels.
- The longer-term demand fundamentals associated with an aging population remain very much in place.
Conclusion
The COVID-19 pandemic has wreaked havoc across the world with lives lost, economies stalled and livelihoods destroyed. The effect of the virus has been far-reaching but disproportionate in its impact. The impact across societies, industries and markets has been mixed. Real estate is no exception.
The disparities in performance across different sectors and markets highlight the need for diversification within the real estate allocation.
As mentioned, many core funds have large allocations to office properties and gateway cities. In a market where transaction volume has stalled, it will be difficult for many core funds to alter their sector and geographic allocations in the near term. While we do not know the longer-term impact on properties and markets, it may be worthwhile considering reallocating capital or increasing exposure to the multifamily and industrial sectors, look toward more growth-oriented markets and/or to non-traditional property types such as medical office, senior living, etc.
See more insights

Retail Investors Put the Squeeze on Hedge Funds
The information and opinions herein provided by third parties have been obtained from sources believed to be reliable, but accuracy and completeness cannot be guaranteed. This article and the data and analysis herein is intended for general education only and not as investment advice. It is not intended for use as a basis for investment decisions, nor should it be construed as advice designed to meet the needs of any particular investor. On all matters involving legal interpretations and regulatory issues, investors should consult legal counsel.
