Articles | February 4, 2022
Trends in Public and Private Sector DC Plan Investment Menu Design, Costs and ESG Incorporation
By Julian Regan
Much can be made of the differences between public sector defined contribution (DC) plans and their private sector corporate counterparts. Despite these differences, however, public sector and corporate DC plans share similar objectives and, increasingly, a view of best practices that are driving important trends in investment menu design, fee transparency and environmental, social and governance (ESG) incorporation.

Public sector and corporate DC plans
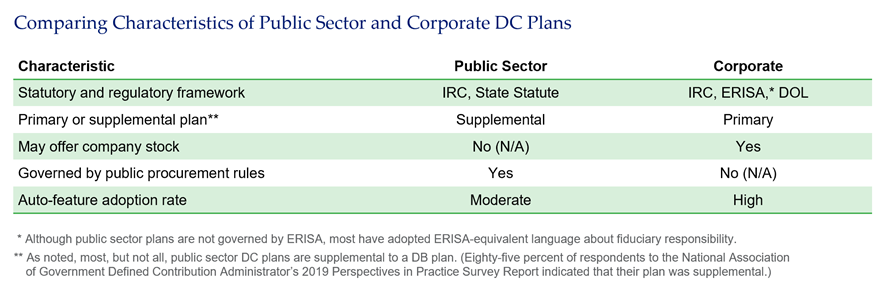
Private sector, single-employer 401(k) plans are now the primary retirement vehicle for corporate America, accounting for a majority of the $7.3 trillion held in all 401(k) plans as of June 30, 2021. In contrast to public sector plans, corporate 401(k) and other defined contribution plans operate under requirements set by ERISA and the DOL, may include company stock as an investment option and overwhelmingly serve as a primary, rather than a supplementary retirement vehicle. These plans also typically include employer contributions, may include profit sharing, adopt auto-features at a high rate and are not subject to government procurement rules in selecting vendors.
Unlike corporate DC plans, public sector 401(a), 401(k), 403(b) and 457(b) DC and deferred compensation plans provide a supplemental benefit to a traditional pension for most participants. Moreover, public sector DC plans are not subject to ERISA and DOL requirements, may not offer company stock and operate under municipal or state procurement rules and other local requirements.
As of June 30, 2021, public sector plan assets included $410 billion held in governmental 457 plans, a share of the $1.2 trillion held in 403(b) plans and the $802 billion held by the Federal Employees’ Retirement System’s Thrift Savings Plan, as well as assets held in public 401(a) and 401(k) plans. These plans operate under a range of governance structures, including autonomous boards, state retirement systems and within human resource or personnel departments at the state or local level.
Common trends in investment menu design, cost structure and ESG incorporation
For all of their differences, public sector and corporate plans share similar objectives and, increasingly, a view of best practices that are driving the following trends:
- Increasing utilization of lower cost institutional investment vehicles
- Improved cost-effectiveness and fee transparency and a declining use of revenue sharing
- Increasing use of target date funds and institutional vehicles that should set the stage for further simplifying investment menu design in line with behavioral finance findings
- A growing trend of ESG incorporation through a number of mechanisms
Size as a factor
Differences in investment vehicle utilization, cost-effectiveness and ESG incorporation across plans are as often a function of size as they are of whether the plan sponsor is a governmental or corporate entity. With the benefit of $1 billion or more of buying power, large plans are increasingly moving to collective trusts and private label investment options to improve cost-effectiveness, investment quality and transparency, while facilitating asset diversification.
Medium and smaller plans, enabled by service providers offering open architecture, institutional share class mutual funds and passive management, have also been part of the trend toward cost-effectiveness and transparency. Anecdotal evidence also suggests larger plans more frequently offer dedicated ESG or socially responsible investment (SRI) options to their participants, although demographic trends may bring large and small plan practices in line over time.
Investment vehicle utilization, cost-effectiveness and fee transparency
While a plan’s size is a key determinant of investment vehicle utilization, it is fair to say that corporate plans more frequently use mutual funds, while large public sector plans more frequently use separate accounts to create custom funds and both are increasing their use of collective trusts as evidenced by the following:
- A July 2021 Brightscope/ICI survey found that 401(k) plan assets were allocated 43 percent and 33 percent to mutual funds and collective trusts, respectively, with the remainder allocated to individual securities/company stock (14 percent), GICs (7 percent) and separate accounts (3 percent).
- The 2019 NAGDCA Perspectives in Practice Survey Report found that white-label (custom) funds held the largest balance of plan assets (34 percent), followed by mutual funds (25 percent), separate accounts (20 percent), commingled funds (13 percent) and multiple vehicles (8 percent).
- In August 2021, PLANSPONSOR reported that collective trusts surpassed mutual funds in 2020 as the most frequently utilized investment vehicle among large 401(k) plans, with collective trusts holding more than 49 percent of assets for 401(k) plans that have assets of $1 billion or more.
While the relatively large size of the median plan in the NAGDCA report, $644.9 million, may explain the utilization rate of custom funds, increasing utilization of lower-cost institutional vehicles across the public and corporate sectors is a firmly established trend.
Improved cost-effectiveness and fee transparency
Total plan costs, as measured by asset-weighted administrative, recordkeeping and investment management expenses, have declined materially for both public and private sector DC plans. For example, Morningstar reported that the asset-weighted expense of 401(k) plans in 2017 was 0.58 percent of plan assets, down from 0.65 percent in 2009. NAGDCA reported that its surveyed plans’ average asset weighted expenses were 0.45 percent in 2018, a decline from 0.51 percent reported in 2015.
Consistent with trends in private and public sector plans adopting more transparent fee structures, Deloitte’s 2019 Defined Contribution Benchmarking Survey found that DC plans’ use of revenue-sharing to pay administrative and recordkeeping costs declined from 50 percent in 2015 to 33 percent in 2019. This change is likely the result of inequities in financing plan costs that may result as an unintended consequence of mutual funds paying different levels of reimbursement to offset recordkeeping costs. In the private sector, fee litigation has also been a likely factor. While a case may be made that public sector plans are generally more cost-effective than corporate plans for a given dollar of buying power, perhaps due to procurement procedures that place a higher weight on cost, plan costs have been declining across sectors over the past several decades for the following reasons:
- Declining mutual fund costs — The average actively managed mutual fund expense ratio declined from 1.08 percent in 1996 to 0.71 percent in 2020, according to an ICI Research Perspectives report. Over the same period, the average index equity mutual fund expense ratio declined from 0.27 percent to 0.06 percent, according to the same report.
- The increased use of passive management — According to multiple surveys, between 33 percent and 37 percent of 401(k) and public sector DC plan assets were allocated to low-cost index funds. That mirrors a rise in passive management’s share of the equity mutual fund market, from 5 percent in 1995 to almost 50 percent in 2019, the Federal Reserve reported in “The Shift from Active to Passive Investing” (May 15, 2020).
- Rising market values — According to the ICI Third Quarter 2021 Retirement Market Data report, the total market value of DC plan assets across sectors increased from $3 trillion in 2000 to $10.4 trillion in September 2021, giving fiduciaries the ability to spread fixed costs over more units to reduce asset-weighted expenses.
- Fiduciary education and industry developments — Industry leadership through groups, such as NAGDCA and the SPARK Institute, and plan sponsors themselves have helped to drive down costs, by encouraging adoption of best practices, including fee assessments, benchmarking and re-bidding. For corporate plans, in particular, fee litigation has also likely been a factor.
Investment menu design: setting the stage for simplification
The number of investment options offered ranges widely, from a relatively few offered by larger plans that may use a single custom option within each asset category to scores of options offered by 403(b) plans that use multiple vendors. Notwithstanding these variations, surveys generally bear out the fact that the average number of options offered by public and corporate plans is similar. For example:
- The 2021 Brightscope/ICI report found that 401(k) plans offered an average of 21 investment options when target date funds are counted as a single option and 28 when they were not.
- NAGDCA reported the median surveyed public plans in 2017 offered 27 options, excluding a brokerage window, while a Pew report found most state plans offered approximately 20. See Investment Options for Public Sector Defined Contribution Plans (January 11, 2017).
Some industry surveys focused on 401(k) plans have reported a decline in the number of investment options among large plans. For example, Fidelity’s third quarter 2021 “Building Financial Futures” reported that the average number of investment options offered by corporate plans with assets of $500 million or more declined from approximately 25 in the third quarter of 2011 to approximately 15 in the third quarter of 2021.
Impact of target date funds
Continued adoption of target date funds for the estimated 90 percent of 401(k) plans and 80 percent of public sector DC plans that offer them, coupled with a move toward institutional funds that discourage duplication and overlap within asset categories, should set the stage for a continued reduction in the average number of options in the future. On the other hand, a potential future increase in ESG, SRI and alternative investment options (discussed below) and the practice of offering participants both active and passive alternatives within asset categories may place pressure on fiduciaries to add options.
A growing trend of ESG incorporation
ESG incorporation is perhaps the most widely publicized trend sweeping the institutional and retail investment industries. In considering ESG adoption, retirement plan sponsors arguably have four mechanisms at their disposal:
- Adoption of investment policy provisions that document ESG criteria
- Inclusion of ESG considerations in selecting investment managers
- Proxy voting on public equity securities that are held in separate accounts
- Shareholder engagement with portfolio companies that are held in separate accounts
While DC plans’ traditional use of mutual funds and other collective vehicles effectively disintermediates them from proxy voting and shareholder engagement, a move towards separate accounts and potential pressure on collective trust investment managers to offer investor-directed proxy voting on underlying securities could open this mechanism to plans in the future.
While statistics are subject to interpretation, U.S. assets under professional management that consider ESG reportedly increased from $12 trillion in 2018 to $17.1 trillion in 2020, according to the U.S. SIF Foundation’s 2021 report, Adding Sustainable Funds to Defined Contribution Plans. DC plans have traditionally achieved ESG incorporation by offering specialty investment options that screen for ESG criteria. While data comparing public and private sector practices is limited, available evidence points to slow, but increasing, levels of adoption and a growing range of incorporation methods:
- In 2018, Principles for Responsible Investment reported that between 2 percent and 8 percent of DC plans offered ESG investment options.
- According to Morningstar, 4.5 percent of plans reported offering an ESG option, while 22 percent incorporated ESG by offering one or more traditional options that reported using ESG in the investment management process.
- According to a PGIM survey, 24 percent of plan sponsors reported taking action to incorporate ESG into their plans over a three-year period.
- A 2021 survey by RBC Global Asset Management found that 71 percent of institutional investment consultants required investment managers to report on ESG utilization, giving plans a way to incorporate ESG by delegation.
- A 2018 Natixis survey found that 82 percent of DC plan respondents wanted investments in their plans that reflected their values.
The number of plans able to report ESG adoption through various mechanisms is likely to continue to grow as investment managers increasingly incorporate ESG into traditional asset categories. On balance, larger plans and those with stakeholders who support ESG goals are more likely to offer specialty ESG options as evidenced by several state and Fortune 500 company plans that offer ESG options.
Regulatory interpretations, as always, will be a consideration and will likely change at the federal level as administrations change. Going forward, demographics including the age and diversity of an entity’s workforce will influence decisions on whether to offer ESG options. This is particularly true given the studies that find younger employees are interested in investing in line with their convictions for creating a more equitable and environmentally sustainable society.
DC plans continue to evolve in investment menu design, cost structures and ESG adoption
Due to their differing roles, stakeholders and regulatory frameworks, corporate and public sector DC plans will continue to include differences in the design of their investment menus and, to a degree, ESG incorporation.
That being said, the following observations hold true:
- Corporate and public sector DC plans — as well as multiemployer plans, which are not the subject of this article — are becoming more cost-effective and transparent to the benefit of their participants.
- A plan’s size, as measured by the market value of participant assets, is arguably a greater determinant of investment vehicle utilization, cost-effectiveness and ESG adoption than whether the plan sponsor is a corporate or governmental entity.
- The increased use of passive management and institutional investment vehicles, as well as target date funds, should set the stage for DC plans to offer fewer investment options in the future.
- Given that investment managers are increasingly incorporating ESG into their security selection processes, the incorporation of ESG into DC investment menus may be an inevitability.
See more insights
The information and opinions herein provided by third parties have been obtained from sources believed to be reliable, but accuracy and completeness cannot be guaranteed. This article and the data and analysis herein is intended for general education only and not as investment advice. It is not intended for use as a basis for investment decisions, nor should it be construed as advice designed to meet the needs of any particular investor. On all matters involving legal interpretations and regulatory issues, investors should consult legal counsel.
