Archived Insight | March 25, 2020
The Near Term Impact from COVID-19 on the Bond Markets
By Don Sheridan
COVID-19 has created a significant disruption in the capital markets for both risky and defensive debt instruments. There really is no similar time period in history to which investors can compare it. For example, contrary to the 2008 Global Financial Crisis (GFC), investors are not being punished this time for leverage, poorly underwritten credit, and a broken global economic ecosystem.

The situation we find ourselves in today is one that is entirely health-related with an unknown timeline. Experts in science, policy, and medicine are now tasked with saving the day by figuring out how to get the virus under control and people back to work.
Credit spreads have widened materially in just a few weeks. Since mid-February, high yield bond spreads have already widened to levels that it took 7 months to achieve at the onset of the GFC. Through March 20, the MTD return for the asset class was -17.3 percent, and YTD returns stood at -18.1 percent.
The Energy sector has been hit particularly hard with a return of -37.5 percent MTD. Energy spreads have widened over 1000 bps these last two weeks to 2300 bps over Treasuries. The broadly syndicated high yield bank loan market was down -17 percent and the proportion of index constituents trading below 90 cents on the dollar had skyrocketed to over 90 percent!
To put this in perspective, in December 2018 when bank loans were experiencing significant outflows, only 10 percent of the index was trading below 90 cents. For the 2008 calendar year return (the worst return on record for the asset class), the bank loan market was down -29 percent.
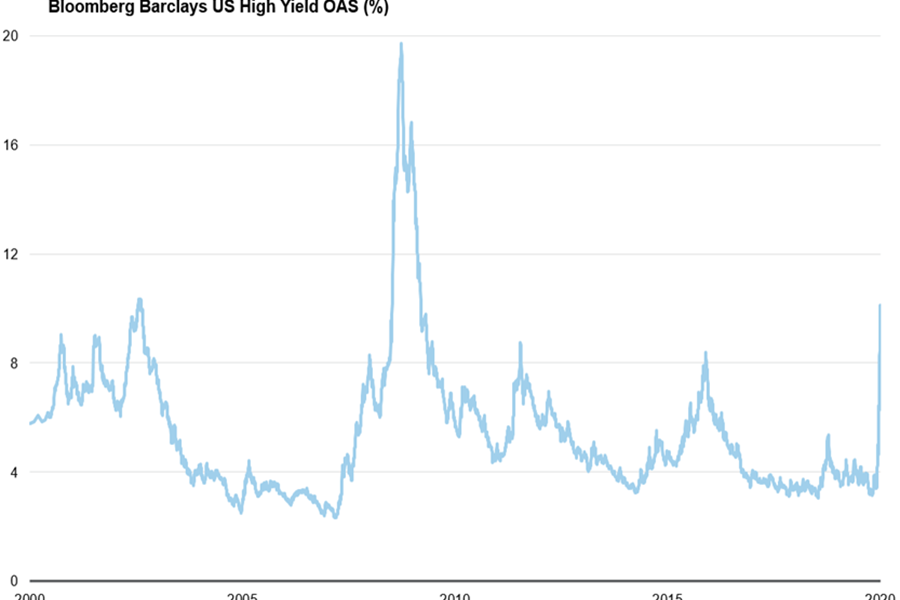
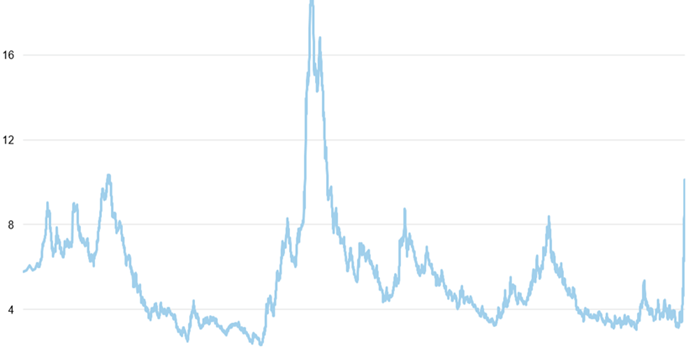
In the chart below, you can see that over the last 20 years, there have been eight instances where U.S. HY spreads moved higher than 800 bps. All have been followed by a significant recovery in the subsequent twelve-month period.
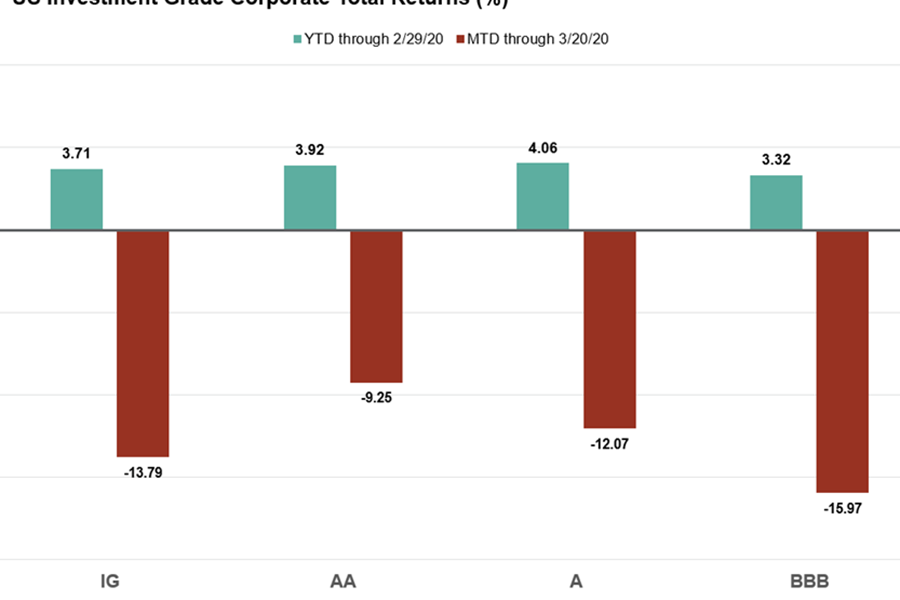
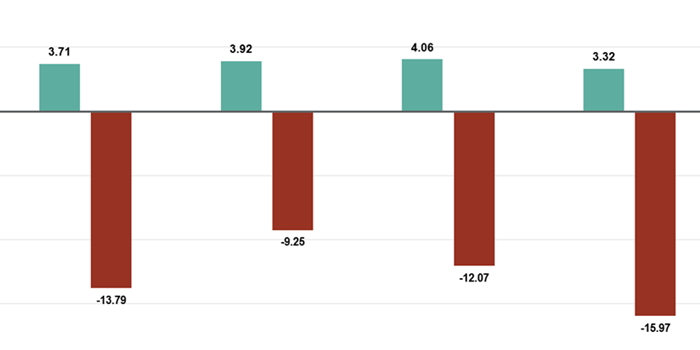
The intensity and speed of the change in pricing has impacted all areas of the corporate bond markets, not just high yield. By March 20, the spread over like-duration Treasuries on the Bloomberg Barclays U.S. Credit index widened to 330 bps (the 2008 peak was 545 bps) and the U.S. Investment Grade Corporate sector has struggled to find a bid even in the highest quality issues.
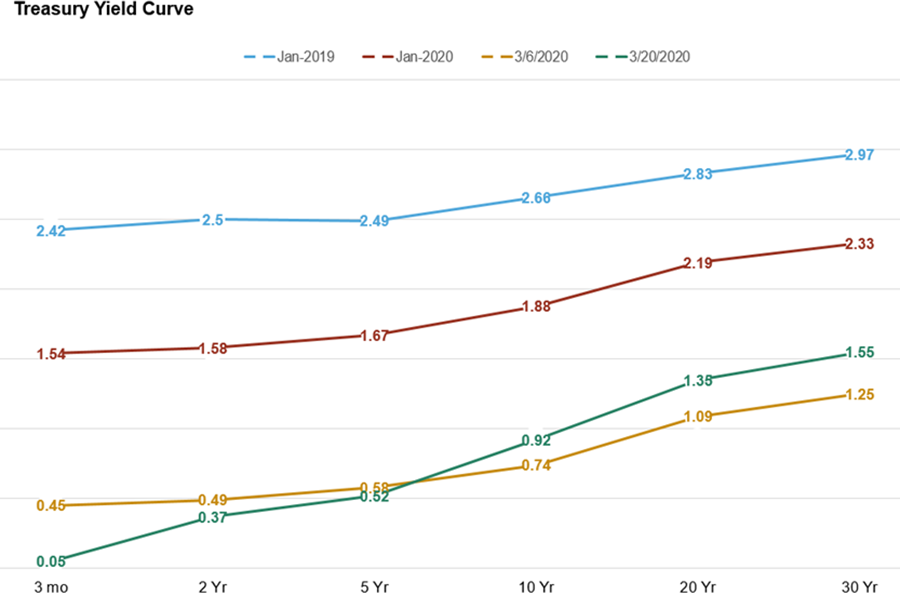
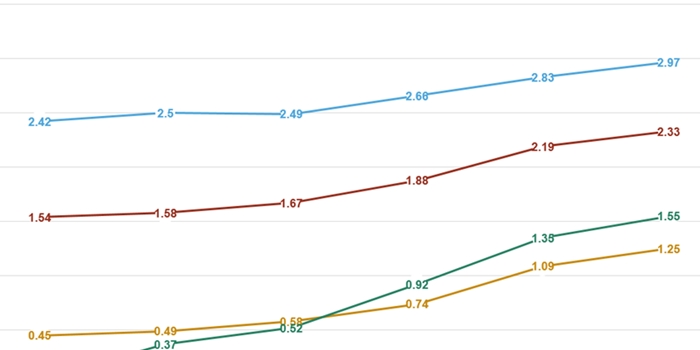
Even Treasury bonds have shown some weakness in the face of a scramble for liquidity as investors rotate into cash. This rotation was happening in spite of the Federal Reserve’s promise to be a provider of liquidity through $500 billion in Treasury bond purchases. However, liquidity has shown signs of returning in the Treasury sector, which is reflected in the very low yields throughout the interest rate term structure in the chart below.
The Fed followed up on its Treasury/MBS purchase pledge from last week by offering quantitative easing “in the amounts needed” in a statement on March 23. In an unprecedented move, the Fed also announced that it has opened up two investment grade corporate facilities (one for the primary market and one for the secondary market) with a starting buying power of $300 billion.
Unlike agency RMBS and Treasury purchases, this extreme measure has never been undertaken by the central bank, not even in the GFC.
The issues of bond market liquidity are likely to persist as daily liquid bond funds are forced sellers into a market that is reluctant to bid and where dealer balance sheets are much reduced since the GFC, effectively removing a market shock absorber.
No area of fixed income is immune as the traditionally “safe haven” municipal bond market has found itself in a historically noteworthy state of dislocation.
As of March 20, the technical selling pressure in that market led to an unheard of Muni/Treasury ratio of over 850 percent for AAA 2-year tax free municipal bond paper (at the time, the yield for the 2-year municipal bond was 2.8 percent while the yield for the 2-year Treasury was 0.37 percent!)
Despite the historical nature of this crisis in fixed income securities, the current lack of corporate defaults provides some solace in a long-term fixed income allocation and the ability for active managers to potentially add value through bond selection.
Even with the illiquidity in some areas of the market, fixed income allocations should continue to be utilized for rebalancing and to raise capital for payment obligations.
The information and opinions herein provided by third parties have been obtained from sources believed to be reliable, but accuracy and completeness cannot be guaranteed. This article and the data and analysis herein is intended for general education only and not as investment advice. It is not intended for use as a basis for investment decisions, nor should it be construed as advice designed to meet the needs of any particular investor. On all matters involving legal interpretations and regulatory issues, investors should consult legal counsel.
