Articles | September 17, 2021
Aging Defined Benefit Pension Plans and the Challenges They Face
U.S. defined benefit (DB) pension plans, like the United States itself, are as mature as they have been in their history. The median age of the U.S. population increased from age 28 in 1970 to age 38 in 2020, while the share of the population over the age of 65 has gone from 10 percent to 17 percent over the same period. The U.S. population is graying due to extended life spans and decreasing fertility rates, among other causes. In addition to these population-wide causes, DB plans are maturing because many plans have been closed or frozen in recent decades, lump-sum payment forms are increasingly prevalent, and very few new plans have come into existence.

Just as societies face certain challenges during the aging process, pension plans have particular pressure points as they reach maturity. One characteristic of a maturing pension plan that is ubiquitous and has meaningful investment implications is the tendency to have negative net cash flow — that is, paying out more in benefit payments than is taken in through contributions. (IFEBP, 2019: 72 percent of multiemployer plans studied have negative net cash flow). We define the “net cash-outflow percentage” as the percentage of assets that needs to be liquidated each year to meet net benefit payments. As the net cash-outflow percentage grows, the more calamitous it is to suffer investment drawdowns for the financial health of the plan.
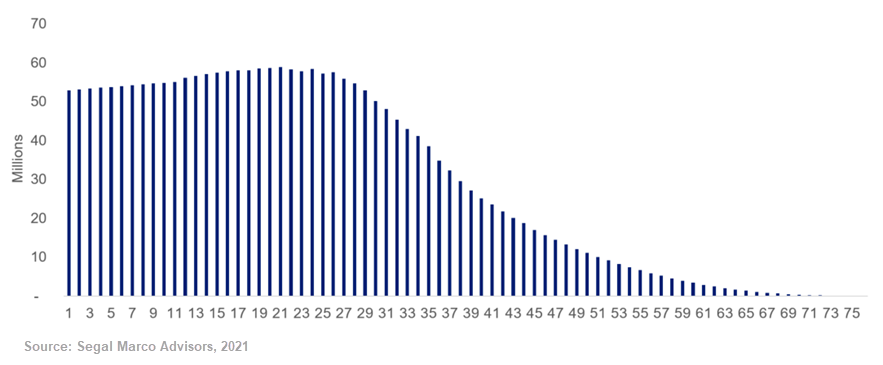
The charts below show different benefit payment projections that produce approximately the same liability when discounted at 7 percent (the expected rate of return for a hypothetical pension plan’s assets).
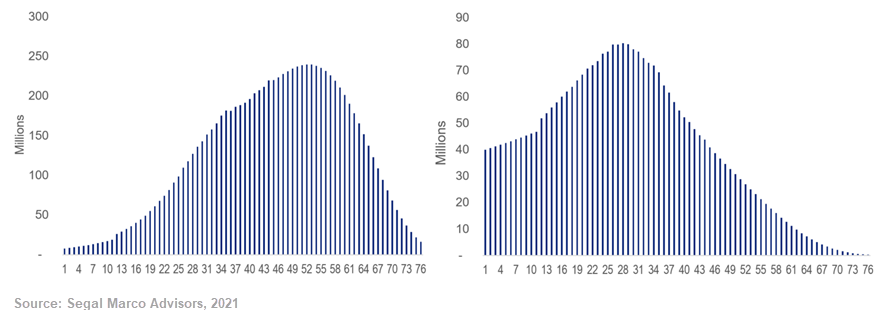
If we assume both plans are fully funded, the plan described in the chart on the right has a much higher net cash-outflow percentage (at about 5.5 percent) than does the plan described in the chart on the left (at about 1.5 percent). As you will observe in the stochastic results below, the downside funded status risk is much worse over a 10-year horizon for the plan with a higher net cash-outflow percentage.
Higher Negative Cash Outflow
| 2021 | 2022 | 2023 | 2024 | 2025 | 2026 | 2027 | 2028 | 2029 | 2030 |
2031 |
|
| 95th | 100% | 116% | 124% | 133% | 139% | 145% | 152% | 159% | 165% | 172% | 179% |
| 75th | 100% | 106% | 109% | 112% | 115% | 117% | 118% | 121% | 123% | 126% | 129% |
| 50th | 100% | 100% | 100% | 100% | 100% | 100% | 100% | 99% | 100% | 99% | 100% |
| 25th | 100% | 94% | 92% | 89% | 87% | 85% | 83% | 81% | 80% | 78% | 76% |
| 5th | 100% | 86% | 80% | 76% | 71% | 69% | 64% | 61% | 58% | 54% | 51% |
Source: Segal Marco Advisors, 2021
Lower Negative Cash Outflow
| 2021 | 2022 | 2023 | 2024 | 2025 | 2026 | 2027 | 2028 | 2029 | 2030 |
2031 |
|
| 95th | 100% | 115% | 122% | 130% | 135% | 140% | 145% | 149% | 153% | 158% | 162% |
| 75th | 100% | 106% | 109% | 111% | 113% | 115% | 116% | 117% | 119% | 121% | 123% |
| 50th | 100% | 100% | 100% | 100% | 100% | 100% | 100% | 100% | 100% | 99% | 100% |
| 25th | 100% | 95% | 92% | 90% | 88% | 87% | 85% | 85% | 83% | 82% | 81% |
| 5th | 100% | 87% | 81% | 78% | 74% | 72% | 69% | 67% | 65% | 63% | 62% |
Source: Segal Marco Advisors, 2021
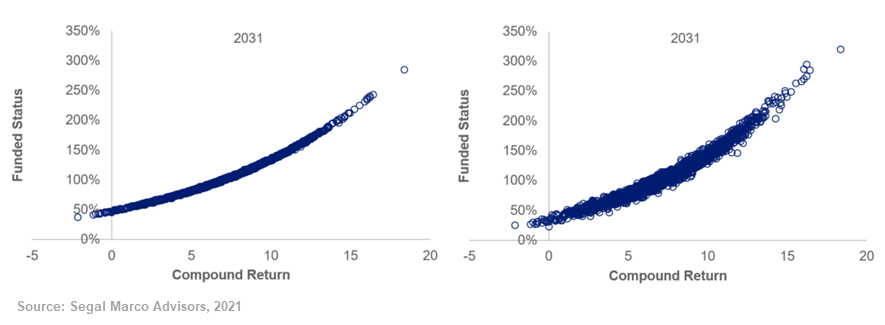
The lower negative cash-outflow plan has a 5th percentile funded status in 10 years that is 11 percentage points higher than the comparable plan with higher net cash outflow (62 percent vs. 51 percent). Additionally, the chart of funded status vs. compound rate of return (below) shows that for plans with low net cash outflow (chart on the left), the funded status at 2031 is (almost) entirely a function of compound rate of return. Whereas, for higher net cash-outflow plans (chart on the right), there is much more variability for funded status given the same compound rate of return. We call this risk, faced by plans with a high net cash-outflow percentage, path-dependency risk. The order of investment returns matters for plans with negative cash outflow.
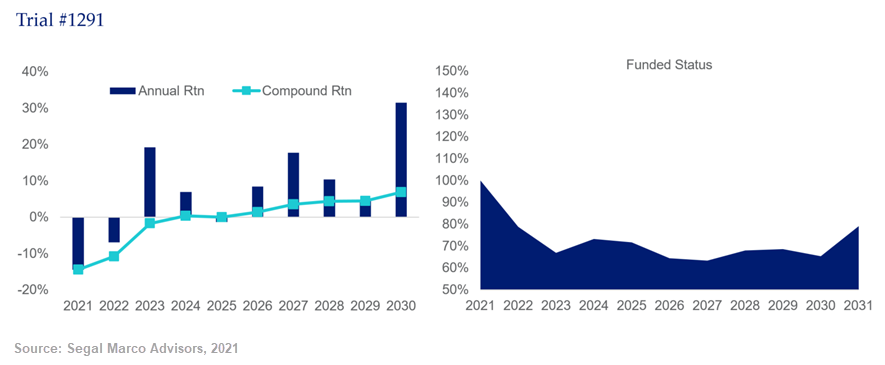
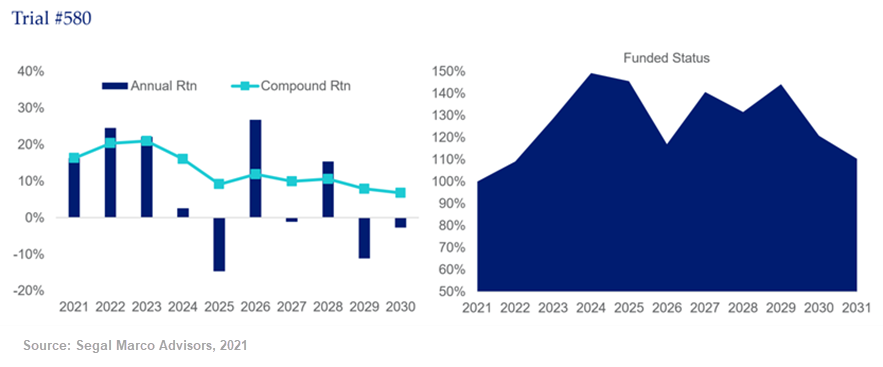
Below are two trials from our stochastic model for the higher net cash-outflow plan, both of which achieve a compound rate of return over the first 10 years of about 7 percent (the discount rate). Although both trials result in nearly identical compound rates of return over the investment horizon, the scenario where investment losses occurred early in the period (Trial #1291) ended with a funded status more than 30 percentage points lower than the comparable scenario where sub-par returns were suffered later (Trial #580) — 80 percent vs. 110 percent.
This type of path-dependency risk does not exist to any significant extent for plans with no (or very little) net cash outflow. We believe it is useful to think of the additional risk faced by plans with higher net cash outflow in terms of added investment risk. In other words, how much additional investment risk for a plan with NO net cash outflow would produce the same downside outcomes as a plan with high net cash outflow (and the current portfolio). The table below illustrates this concept:
|
Current Portfolio (Volatility of 9.5%) |
Portfolio Volatility of 13.8% |
||||
|
High Net Outflow |
Low Net Outflow |
Theoretical |
Theoretical |
||
| 95th | 179% | 162% | 158% | 193% | |
| 75th | 129% | 123% | 121% | 131% | |
| 50th | 100% | 100% | 100% | 100% | |
| 25th | 76% | 81% | 83% | 76% | |
| 5th | 51% | 62% | 63% | 51% | |
Source: Segal Marco Advisors, 2021
Notice first that a plan with low net outflow is very similar to a plan with no cash flow. The more important observation is that a plan with high net cash outflow and portfolio volatility of 9.5 percent is similar (in terms of downside funded status risk) to a plan with no net cash flow and portfolio volatility that is 45 percent higher, at 13.8 percent annual volatility. Further, this “breakeven (no cash flow) volatility level” will increase as net cash-outflow percentage increases. To illustrate further, we modeled a set of projected benefit payments with an even higher net cash-outflow percentage to observe the impact on the “breakeven volatility level.” You can see the results in the table below. Increasing the net cash outflow percentage from 5.5 percent to 7.5 percent increases the “breakeven volatility level” to 17.1 percent (from 13.8 percent) — which is nearly as much as the increase we observed with change from 1.5 percent to 5.5 percent net cash-outflow percentage.
| Approximate Net Cash-Outflow Percentage | Downside Funded Status Risk | Breakeven No Cash-Flow Volatility Level |
| 0.0% | 63% | N/A (9.5%) |
| 1.5% | 62% | 9.9% |
| 5.5% | 51% | 13.8% |
| 7.5% | 44% | 17.1% |
Source: Segal Marco Advisors, 2021
Net cash outflow dynamics by market
Single employer plans are characterized by contribution rules that generally increase contributions when investment performance is poor. This dynamic is a factor that mitigates negative cash outflow and path-dependency risk. The responsiveness of contributions to asset performance has been materially reduced due to the recent passage of APRA through increased amortization periods.
Taft-Hartley plans are characterized by contributions that have very little responsiveness to asset performance as they are determined through the collective bargaining process and renegotiated only periodically. Path-dependency risk is therefore a particular concern for these plans.
Public/municipal pension plans lie somewhere in between single employer plans and Taft-Hartley plans in terms of the responsiveness of contributions to asset performance (asset losses are generally amortized in contribution calculations, but over very long periods) and therefore their exposure to path-dependency risk.
Conclusion and next steps
- Most pension plans today pay out significantly more in benefits than they take in through contributions — that is, they have net cash outflow.
- We call the proportion of assets needed to meet this net cash outflow the net cash-outflow percentage.
- Plans with higher net cash-outflow percentages face additional risks that aren’t faced by plans with lower net cash outflow percentages — namely, path-dependency risk.
- It is useful to quantify path-dependency risk using investment risk terminology, specifically as an additional amount of portfolio volatility.
- For instance, a plan expected to earn the discount rate with portfolio volatility of 9.5 percent and a high net cash outflow percentage is similar (in terms of downside risk) to a plan with no net cash flow and a portfolio volatility of 13.8 percent.
- In the next blog in this series, we will consider what (if any) investment strategies can be used to combat path dependency risk.
Stochastic modeling parameters
We have run a stylized stochastic model associated with the net negative cash-outflow scenarios (described above). Consider an investment set that includes only two uncorrelated asset classes as follows:
- Bonds that yield 3 percent across all horizons and have no volatility
- Risky assets with expected return of 12 percent and annual volatility of 20 percent
A portfolio equally weighted between these two asset classes would have the following return expectations (assumes continuous compounding and rebalancing):
| Arithmetic Return | 7.4% |
| Annual Volatility | 9.5% |
| Compound Return | 7.0% |
Source: Segal Marco Advisors, 2021
Projected Cash Flows for Plan with Net Cash-Outflow Percentage of 7.5 Percent
See more insights

Q3 2021 Investment Outlook: A Rose by Any Other Name Would Smell as Sweet

Pension Plan Funded Status Drops Slightly as Interest Rates Decrease in Q2 2021

Top Five Reasons the U.S. Fed Will Keep Rates Low for Now
The information and opinions herein provided by third parties have been obtained from sources believed to be reliable, but accuracy and completeness cannot be guaranteed. This article and the data and analysis herein is intended for general education only and not as investment advice. It is not intended for use as a basis for investment decisions, nor should it be construed as advice designed to meet the needs of any particular investor. On all matters involving legal interpretations and regulatory issues, investors should consult legal counsel.
