Articles | May 12, 2021
Spending Spree or Disappointing Drip?
Much has been written about the boost to the economy as Americans leave the sanctuary of their homes and venture out into shopping malls, restaurants, airports and theaters. A number of market followers see this impact, when combined with already arriving stimulus, as possibly providing a further kick to the stock market. As the economic recovery broadens and extends, it may do so robustly enough even to cause a pop in inflation after a decade of being flatlined. The question we raise here is whether those expectations are unrealistic and perhaps based upon data that by itself doesn’t tell the entire story.

On the plus side, there is little question that the most recent stimulus will be supportive of economic growth — one can’t push $1.9 trillion into various hands and not expect a good bit of that to find its way into spending by consumers, businesses and governments. Yet, a look at the longer-term trend of GDP seems to indicate that this will enable us to return to where we were back in 2019 which, lest we forget, was characterized by “low and slow” growth rates in the 2 to 2.5 percent range. This level of growth, according to our process for capital market assumption development, is, when combined with other factors, enough to support long-term U.S. equity market compound returns in the 7 percent range at best.
The second major factor in defending the spending spree forecast comes from the expected decline in unemployment with a return to the low levels we experienced prior to the pandemic last year. No doubt that more people working means more people earning, as well as more people spending. Again, if this does come to pass, it means growth returns to where we were pre-pandemic, as opposed to an accelerated level outside the somewhat anemic growth rates of much of the last decade. There are additional signs that growth expectations will not be fully realized, as many of the boomer generation will exit the workforce completely and a number of families will choose to continue the single bread-winner strategy that became so prevalent during the pandemic. The labor force participation rate, which was already trending down before the lockdowns, may not recover to prior levels after all.
Finally, though, is the biggest factor — Americans have been saving, and saving like never before. They’ve been putting money aside waiting for the day when they are unshackled by the virus and can safely Uber Black to the airport, grab a $3 bottle of water and that new bestseller, fly to New York City, head out for great steaks, and then take in a show on Broadway or catch a cab to Yankee stadium to watch the Bronx Bombers lose to the White Sox. The evidence of this pent-up demand can most clearly be seen from the Board of Governors of the Federal Reserve System’s well-documented data on the wealth of U.S. citizens as defined by their total assets less liabilities. As reported by many, from the first quarter of 2020 to the end of the year, Americans amassed an amazing $18T in wealth — that is, over a starting point of $104.8T, an increase of a whopping 17 percent for the average citizen. Get ready for the unleashing of the debit cards throughout the land!
Let’s drill down into those numbers. Averages, which many pundits seem to favor as a way to express complex topics to the public and generally support their predefined point of view, can be misleading in many cases, and that may be true here.
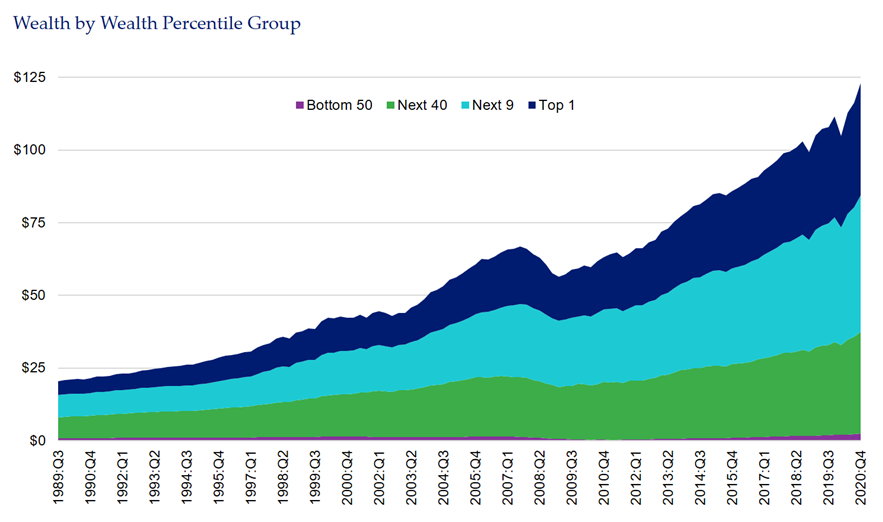
When we break down the Fed’s data, we note that of the amazing increase in wealth, 40 percent represents adding to the already substantial pot of money in the hands of the top 1 percent of the richest Americans and 36 percent went into the coffers of the 90th to 99th percentile of the wealthiest. To sum that up, in case the point needs to be more clearly made, of the increase upon which the potential spending bonanza is at least partially based, 76 percent of that was a boost to the balance sheet of people who started with an average (yes, dangerous) of over two million in net worth. So, we come to the first big question underlying the assumption regarding a spending spree: Will the top 10 percent of the wealthiest Americans, with the opening up of the post-pandemic economy, return to consumption patterns of the past? Or will they open up their wallets and spend down some of the gains of the last nine plus months (and will they buy American goods and services)?
There is some additional positive news in the wealth accumulation numbers, however. The rest of the country, (the other 89 percent of the population or about 300 million people,) has had a substantial increase in their assets as well — from Q1 to Q4 2020 this increase was around 13 percent — certainly nothing to sneeze at. It appears likely that this cohort gained much of this increase not from appreciation in equities, but from various rounds of stimulus that occurred during 2020. The problem is that this vast swath of Americans represents only 24 percent of the growth in assets, but nearly 90 percent of the citizens. Unleashing these dollars, or a large portion, would nonetheless be a substantial boost to the economy overall especially given expectations that the spending would likely be largely domestically focused. Unfortunately, the social reality is that this is the segment of our country that is in the most need of increasing savings, especially for often inadequately funded retirement plans or first homes for young families.
The data in the above graphic from the Fed also provides other ways to slice the American wealth pie — for example by age cohort. A potential positive is the fact that today’s retired or retiring population — ages 55 and up — have a greater share of total wealth than ten years ago (67 percent versus 70 percent today) and therefore may be more likely to spend in retirement. While the millennials have a smaller percentage of wealth now versus 2011 (5 percent of the total versus 6 percent), the possibility that student loan debt is forgiven would be a further boost to their spending habits. If that were coupled with additional spending on infrastructure, this economy could have the faucets opened wider and, at least temporarily, end the drip syndrome.
To conclude, it is reasonable to expect that there will be some measurable uptick in spending assuming we continue to progress towards a more normal post-pandemic environment. Will this be characterized as a spree? Well, that is a description that defies measurement and we’ll leave it to others to decide. When measured in GDP terms on a year-over-year basis, it is likely that we will see GDP growth numbers that will be eye-popping and even historic. Although some of this can be directly related to stimulus and pent-up demand, a good portion will simply be the result of measuring the current and future quarters against a prior period of rapid economic decline due to the virus. Nonetheless, favorable GDP growth rates in the near-term do not somehow harbinger the U.S. economy breaking out from the modest growth trend that characterized the last decade. As we have described in earlier writings, that sort of result does not come from short-term stimulus, nor can it be wholly driven by an accommodative monetary policy from the Fed. Productivity improvements and increases in labor force participation, as precursors to enable businesses’ true capital reinvestment, are the ingredients for the U.S. to change its economic future for the better. While it is not the only answer, a growing chorus seems to be rising to echo the notion that the inequity represented by the Fed’s wealth distribution graphic is certainly part of the problem.
See more insights
The information and opinions herein provided by third parties have been obtained from sources believed to be reliable, but accuracy and completeness cannot be guaranteed. This article and the data and analysis herein is intended for general education only and not as investment advice. It is not intended for use as a basis for investment decisions, nor should it be construed as advice designed to meet the needs of any particular investor. On all matters involving legal interpretations and regulatory issues, investors should consult legal counsel.
