Amid this year’s historically volatile and transformational period for bond markets, we can add the worst ever six-month return for the Bloomberg U.S. Aggregate Index, which is the benchmark used for measuring many core fixed income portfolios. The main reason for this difficult environment is that interest rates across the globe have shifted significantly higher.

While rate increases may have been expected, the market response to higher-than-expected inflation was swift and large. The inflation dynamics that have surfaced are due to supply chain bottlenecks, increased input costs to production, fiscal stimulus, an unanticipated full-scale war initiated by Russia and the reckoning of developed market central bank policies.
Prior to the COVID-19 pandemic, the U.S. Federal Reserve (the Fed) balance sheet and a zero-rate policy were really the two potential catalysts of concern for triggering “unwanted” inflation. The market environments leading into 2020 and then again in 2022 weren’t ones that appeared to be riddled with other culprits, like excess corporate leverage, currency devaluation or deteriorating fundamentals. The world was unprepared for the inflationary catalysts of the global pandemic, namely spending (both fiscal and consumer), and then drastic changes regarding energy trade linkages that are still unfolding in 2022.
Current concerns
Alarm bells are ringing today with four catalysts triggering both realized inflation and uncertainty regarding future inflation. In response, the Fed and other developed market central banks are implementing much more hawkish policies, which is in direct contrast to the messaging coming into the year.
This attempt to address inflation is a front-loaded exercise with policy rates and anticipated rate hikes now moving higher at a rapid pace. Expectations are for the U.S. to approach a 3.5 percent fed funds rate by the end of the year. As this benchmark rate is the starting point of the interest-rate-term structure, the Fed has a great deal of influence in the overall short-maturity segment of the curve. Although the impact further out the curve has also been significant, that is not where monetary policy tools, in isolation, have any direct control.
However, when the central bank buys longer duration Treasuries and mortgage-backed securities through quantitative easing (QE), its influence further out the curve can be significant. With the intention today being to wind down QE and begin embarking on quantitative tightening (QT) in an effort to shrink a $9 trillion balance sheet, the yield adjustment to the longer-dated portion of the curve is mostly the result of capital markets repricing term structure premiums, the diminishing central bank Treasury purchase impact on price and long-term inflation premiums.
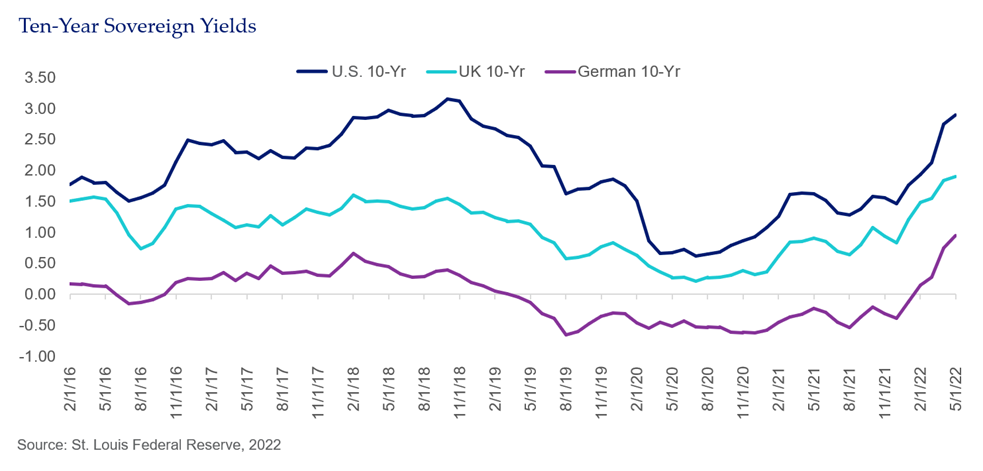
The chart below shows the yield impact to developed market 10-year government bonds resulting from these adjustments to various premiums.
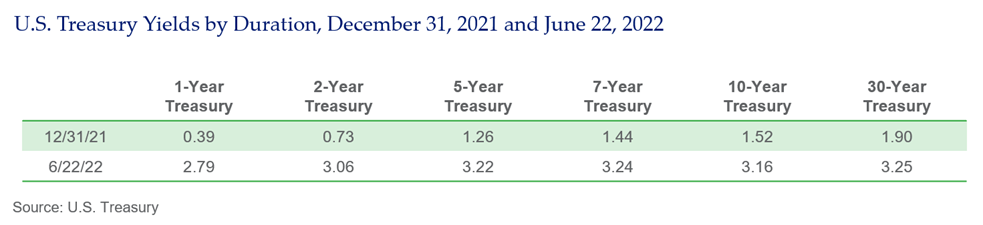
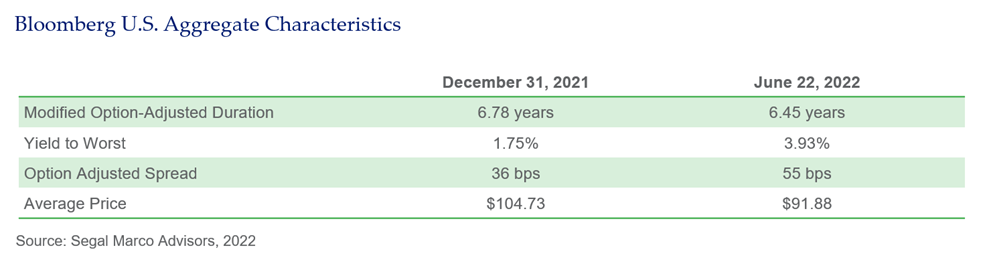
The resulting performance in both short- and long-duration investment-grade fixed income has been unsettling. Year-to-date performance for the Bloomberg U.S. Aggregate Index was - 11.1 percent through June 22. This magnitude of negative performance is high by historic measures. One would have to go all the way back to the early 1980s to see a similar bond repricing environment. However, the Bloomberg U.S. Aggregate Index structure was entirely different then, when the public investment-grade fixed income markets of today were just developing.
What might happen next?
What should investors expect from here in core fixed income? As mentioned, it is difficult to point to another market environment similar to the one we find ourselves in right now. However, there are measurements over the last 20 years that can help frame forward-looking expectations. Running regressions can uncover correlations. Monetary policy in conjunction with components of medium-to-long-term nominal Treasury securities tend to be good proxies for evaluating the health of the Bloomberg U.S. Aggregate Index and its future return potential.
The following chart shows three different key measurements worth analyzing. The green line is the well-known U.S. fed funds rate. The purple line is the 10-year breakeven inflation rate. This is the level of inflation being priced into the market at the 10-year point in the yield curve. When you combine this with the 10-year real yield (which is the dark blue line), you arrive at the nominal 10-year Treasury yield.
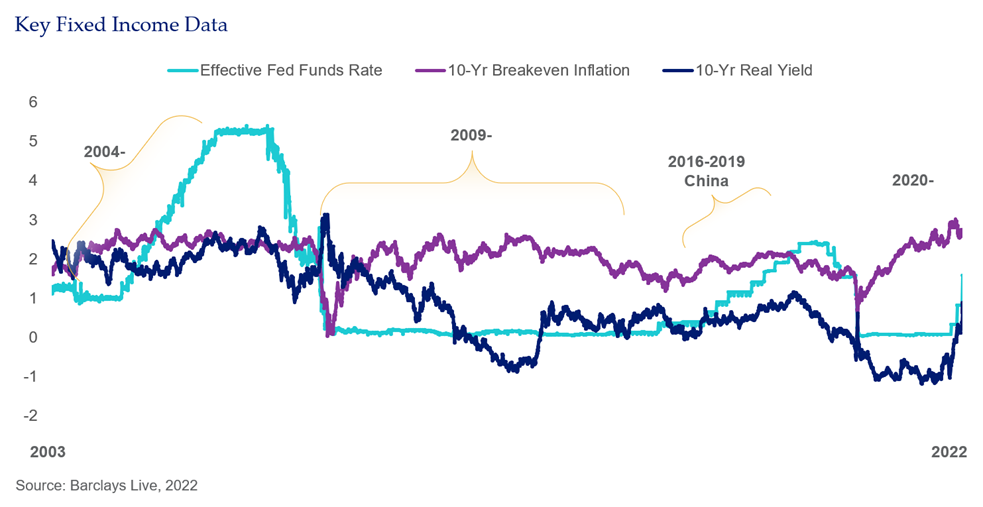
The market has so aggressively recalibrated inflation across the curve that most of the Fed’s longer-term intention is now priced in. How much further can inflation go from here? A year ago, many thought a yield on the Bloomberg U.S. Aggregate Index north of 2 percent was a thing of the past. Well, it looks like that notion has gone out the window.
Now hopes are that stability takes hold and the real historical diversification benefit from investment-grade fixed income reemerges. It is important to note that reinvestment at higher yields, which we now have, provides a cushion and potential total return enhancement benefit over time.
The 75 percent government and agency mortgage-backed securities component of the Bloomberg U.S. Aggregate Index is also a feature that helps protect during corporate credit deterioration. This is important when considering that, at least in the U.S., the Fed is committed to breaking inflation and a recession is possible in getting there. So even if fundamentals change course, the Bloomberg U.S. Aggregate Index in its current state is a pretty good place to continue to park a large portion of fixed income assets for an investment portfolio.
See more insights

Stagflation: What Is It, and Is It on the Horizon?

U.S. Dollar Strength

Understanding Manager Styles in Growth Investing
The information and opinions herein provided by third parties have been obtained from sources believed to be reliable, but accuracy and completeness cannot be guaranteed. This article and the data and analysis herein is intended for general education only and not as investment advice. It is not intended for use as a basis for investment decisions, nor should it be construed as advice designed to meet the needs of any particular investor. On all matters involving legal interpretations and regulatory issues, investors should consult legal counsel.
