Articles | March 9, 2021
Cozy: The U.S. Economy in Three Graphs
One of the promises of every politician seems to come down to an expression like “to get this economy moving again.” Yet despite over a decade of programs designed to fuel the fires of growth, the U.S. seems to find itself sitting by the warmth of glowing embers rather than the snapping and crackling of a roaring blaze. While a complete explanation is clearly complex and requires a bunch of PhD economist types to fully describe, for most of us the answer comes down to just a few straightforward graphics.

Economic growth is largely dependent upon two key variables: changes in labor force participation and productivity levels. This notion is pretty simple — if there are more people producing than there were last year then, all other things being equal, the gross domestic product will generally increase. In addition, if those people who are producing are actually producing more because their output is higher (mostly due to the application of new processes and technology), then even if there is no increase in the number of people producing, the gross domestic product will still generally increase. Naturally, if both of these are increasing, then you get significantly higher growth.
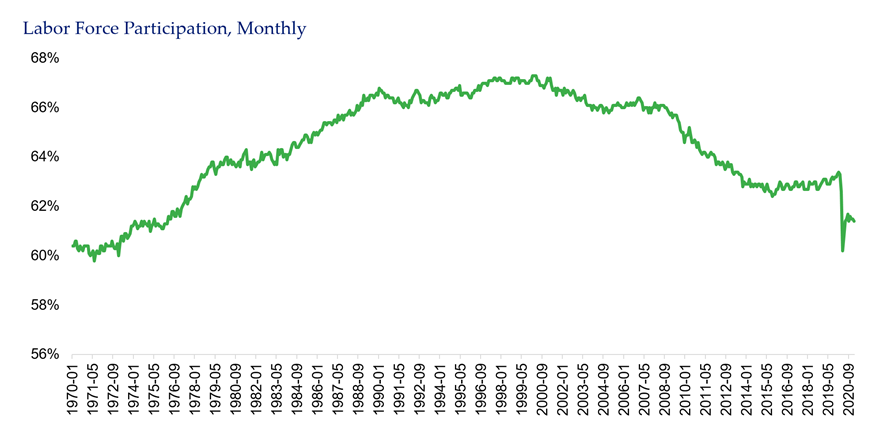
So, where are we today in terms of these two crucial elements of growth? The first graph represents labor force participation in the U.S. going back to 1970 as provided by a favorite source for such data, the Federal Reserve Bank of St. Louis. What is notable is that after the recession in the 2000-01 period participation climbed back somewhat, but never returned to trend. Then, with the Global Financial Crisis, the decline was precipitous and despite all of the stimulus it only stabilized around 2015, starting to slowly rise before being slapped down by the pandemic.

Source: Fred
Explanations for the lack of a normal post-recession recovery abound, from people opting to go on to higher education, boomers deciding to just stop working, and millennials beginning to have children, which often removes one parent from the workforce. Regardless of the rationale it is difficult to foresee, given these influences, any resurgence in labor force participation without significant changes to how it is structured (longer family leave to encourage important baby bonding while discouraging actually leaving the labor force, later retirement ages, educational systems to reward continuing to work and on-the-job vocational training are some potential solutions).
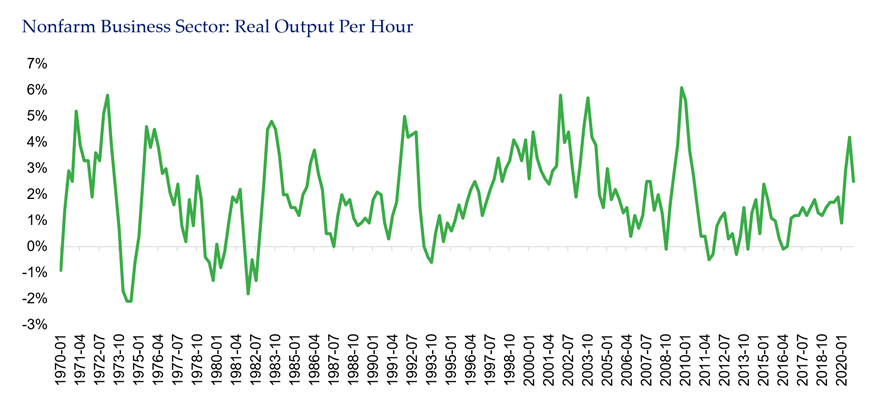
The picture for productivity is less stark, but very similar in terms of status. A good proxy for productivity is the output per hour worked, which is shown in the second graph. While this measure has shown a good deal of seasonal and recession/recovery volatility it is clear that the midpoint for the highs and lows of the growth rate has fallen substantially since the GFC in 2008-09.

Source: Fred
Interestingly, there are several reasons to expect that there should be improvements in this important variable, including technology developments, global value chains and rising educational levels. Notably, there is not a universal perspective on why productivity growth has fallen. We summarize a few of the reasons below (incidentally, this is a global phenomenon):
- Slowdown in capital investment post the GFC
- Poor capital allocation allowing zombie companies to continue to operate unproductively
- Excessive regulation continues
- The service economy transition reduces the impact of technology
- Government borrowing crowds out the bank savings and lending process
- Poor infrastructure
- The aging population
- Deglobalization has undermined advantages of global value chains
While these issues are too complex to tackle here, there seems to be agreement that a combination of embedded structural challenges and suboptimal government policy are the principal culprits. As with the labor force growth, it will certainly require a combination of programs and approaches to address these if the productivity challenges are to be reversed.
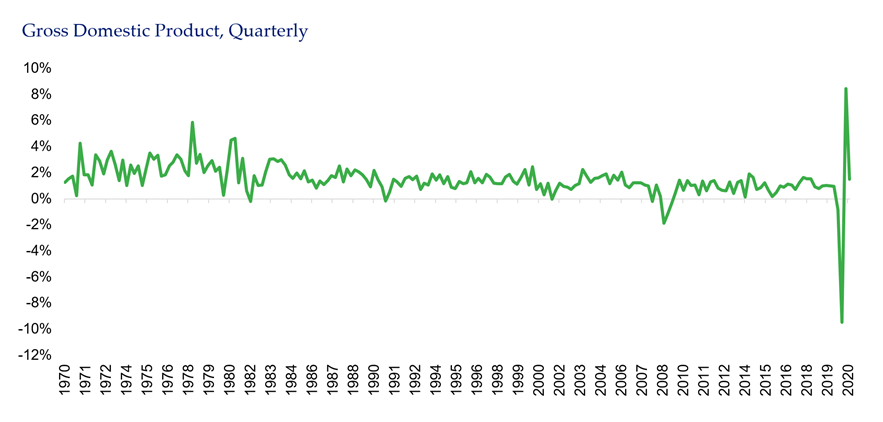
The net result of all of this is a growth pattern that has, even ignoring the spikes of recession and recovery, settled in at a lower level than in previous decades.

Source: Fred
A second observation is that, again ignoring the spikes, the level of short-term volatility in GDP growth has lessened, which is not surprising given the lower averages. The question? Is a lower and less volatile pattern of growth for the U.S. and most developed economies an acceptable outcome or perhaps simply the way it’s going to be in the future? Perhaps, especially given an environment where almost any policy issue becomes mired in partisan squabbling, we should just get used to it being a little chillier economic climate. That reality may go hand in hand with good conservation and we just need to wear more sweaters.
See more insights

Equity Markets in 2018: Reflecting on a Volatile Year

Earnings Woes for S&P Firms with More than Half of Sales Coming from Outside the U.S.

Financial Intermediary Consulting: a Primer
The information and opinions herein provided by third parties have been obtained from sources believed to be reliable, but accuracy and completeness cannot be guaranteed. This article and the data and analysis herein is intended for general education only and not as investment advice. It is not intended for use as a basis for investment decisions, nor should it be construed as advice designed to meet the needs of any particular investor. On all matters involving legal interpretations and regulatory issues, investors should consult legal counsel.
