Articles | March 3, 2021
The U.S. Fiscal Condition: “Another Day Older and Deeper in Debt”
1. The U.S. Debt Burden
The refrain from the song “Sixteen Tons,” sung by Ernie Ford in the late 40s, seems appropriate as the U.S. continues to add to its mountain of debt, with the pandemic stimulus piling on even more of late.

The remote server returned an error: (403) Forbidden.
This leads us to the question of whether there is such a thing as a limit — what could be too much debt? There has been an increasingly popular construct, Modern Monetary Theory (MMT), postulating that government debt may not be nearly as destructive as we have been led to believe. Is that feasible, or are we to a point where radical changes in expectations, such as putting off long-anticipated retirement dates, are in the cards? Perhaps, as Ford sings it: “Saint Peter don’t you call me ‘cause I can’t go, I owe my soul to the company store.”
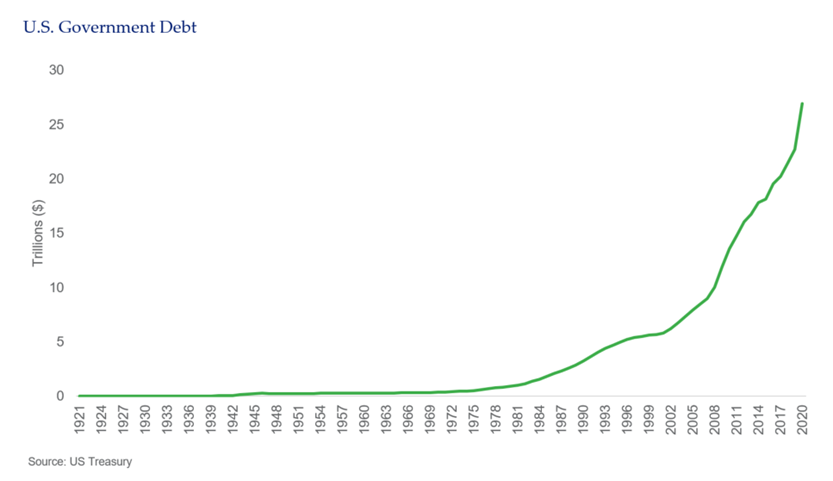
U.S. debt — how much really?
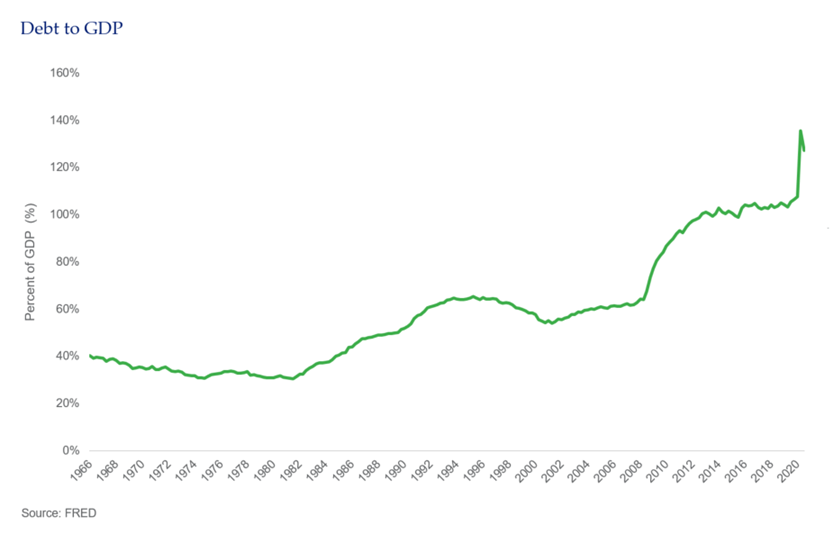
The absolute level of debt is not the most relevant measure of the mountain, but rather the relationship of debt to the size of the overall economy. This graph from the Federal Reserve Bank of St. Louis (FRED) puts that into perspective dating back to the mid-1960s with a simple conclusion — the amount of U.S. government debt in relation to the size of the economy has skyrocketed since the Great Financial Crisis and is inching quickly towards 140 percent. In our mountain analogy the 90s were the Appalachians, the 2010s the Sierra Nevadas, and we are now looking like the Rockies. In fact, taking these numbers back to WWII we have greater debt to GDP than since the period of time coming out of that conflict and without the expectation of a generation of GI’s returning to the states in a mood to work hard, raise families and spend money.
Not the whole debt story however
Private debt, loans and debt securities in the U.S. have actually been declining for most of the last fifteen years. As high as 168 percent of GDP in 2007, it declined to 150 percent as of 2019 according to data from the International Monetary Fund (IMF). Despite this decline, it is relevant to note that if we use the mid-60s as our base that does not compare favorably to the 88 percent of GDP number in 1965. Household debt has also been on the decline recently, falling from a high of around 100 percent of GDP to a current level of around 75 percent. As with private debt this trend seems positive, but has to be considered in the long term context of a comparable number of around 45 percent in the mid-60s. We also have to be aware that these levels of debt have varying impacts on different demographic cohorts — student loan debt, for example, has increased to 7.8 percent of GDP from a level less than 2 percent only 15 years ago — an increase which can create structural problems effecting areas such as home ownership.
And then there’s more….
Currently Medicare consumes a little less than 4 percent of GDP per year. That figure, which was as low as 2.2 percent in 2000, is projected to increase to 6 percent by 2040. According to the Administration the current unfunded liability (the amount that would have to be added now in order to, along with current contributions, meet projected costs over the next 75 years) is about $5.3 trillion, or another 25 percent of GDP. By the way, current trust fund balances are expected to be fully depleted by 2026. Then there is Social Security (OASDI), where the trustees estimate the unfunded obligation for the next 75 years at another $13.2 trillion, which is over 60 percent of 2020 GDP. Put another way, eliminating this shortfall would require an immediate increase in the payroll tax of 4.2 percent or a reduction in benefits of 24 percent. Any way you define it these debts (defined as promises to pay in the future) are substantial.
We can now add in the unfunded liabilities from the Federal Employees Retirement and Disability Systems (est. $1T) and that of state and local government pensions plans (est. $4T) and that is an additional obligation of nearly 25 percent of 2020 GDP.
2. What’s Different Now?
Sir John Templeton is famously quoted as saying “the four most dangerous words in investing are: “this time it’s different.” What Mr. Templeton was referring to is investors who make a case that something in our world (i.e. macroeconomic, geopolitical, climate, etc.) has permanently changed and, therefore, current macroeconomic and/or market outcomes and circumstances are justifiable. Typically, we see this quote resurface when we experience an environment or circumstance that, historically speaking, led to bad outcomes. Enter debt levels and deficit spending in the U.S., which according to the Congressional Budget Office (CBO) are projected to double to 200 percent of GDP over the next 30 years (https://www.cbo.gov/publication/56516). But maybe this time is different. Maybe high levels of debt are a part of this “new normal” that everyone seems to be talking about. Mr. Templeton lived a very full life and passed away in 2008 at the age of 95. In his lifetime, he witnessed two World Wars, the Great Depression, the Global Financial Crisis (GFC), the Cold War, the removal of the gold standard, hyper-inflation, stagflation, deflation, etc. It’s difficult to say someone’s seen it all, but he saw more than most. However, over the course of his long and fruitful life, there are some things he had never seen.
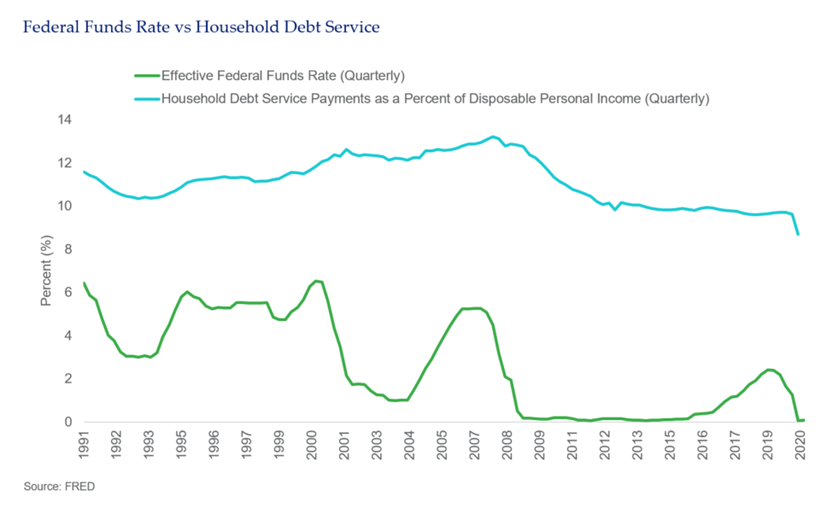
Let’s start with interest rates, which we believe have been one of the most influential macroeconomic influences over the past 12 years. In his 95 years on this planet, Sir Templeton had been through yield curve control during and after World War II, the Volcker era of double digit interest rates in the late 70s and 80s, and everything in between. However, he had never seen an interest rate environment like the present. The lowest yield he had ever experienced on a 10-year U.S. Treasury was 1.7 percent in 1945, which is around 100 bps higher than the yield offered today. I have to imagine the phenomenon of negative interest rates was in no way mentioned in any macroeconomics textbook he read during his education or career. The biggest issue or concern around the amount of debt a borrower takes on is their ability to service (make regular interest payments) and re-pay the debt. I think it’s safe to say that the European Central Bank (ECB), the Bank of Japan (BOJ), and others borrowing at negative interest rates are having no problems repaying loans for less than the amount they borrowed.
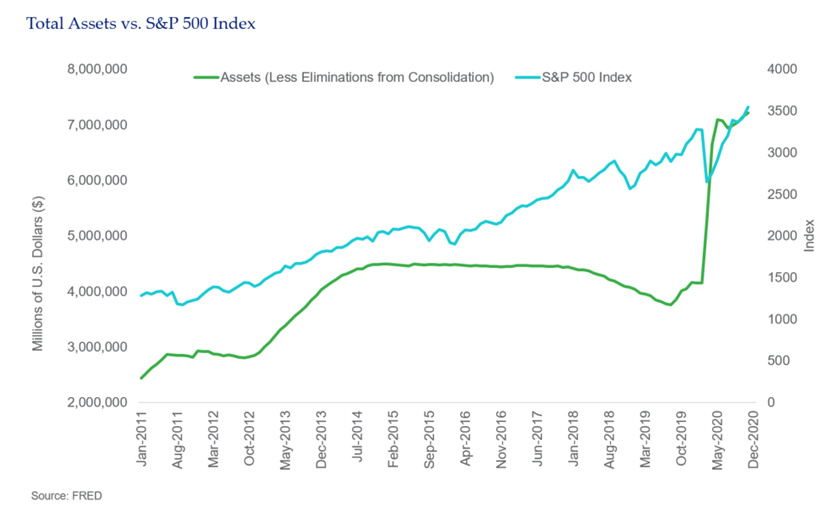
Quantitative easing, the asset purchasing program enacted by the Federal Reserve, wasn’t announced until after his passing in 2008. This dramatically increased the overall size of the Federal Reserve’s balance sheet. However, after looking at the chart below it’s hard to argue that this policy did not materially contribute to the economic recovery coming out of the GFC and strong returns in financial markets.
Or what about COVID? The most recent COVID-19 induced economic shock was unlike anything the world has ever seen (admittedly, Sir Templeton lived through the Spanish Flu, however, he was only 6 years old when it reached the U.S.).
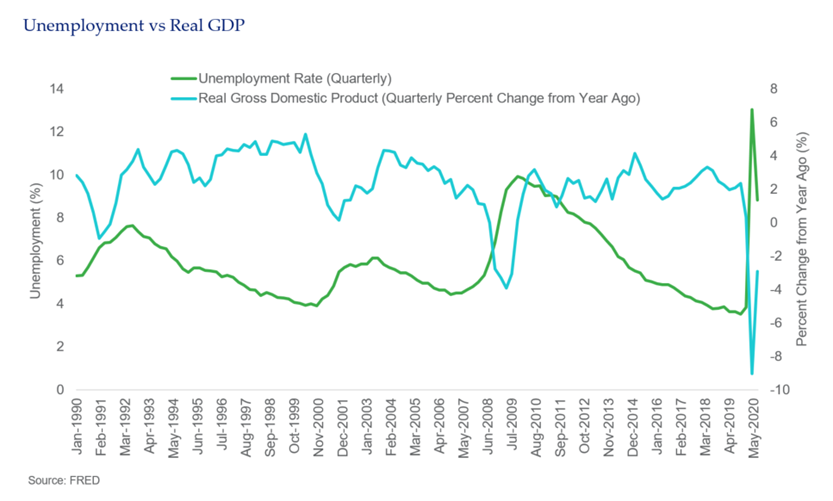
During the depths of this most recent crisis, Gross Domestic Product (GDP) in the U.S. dropped by about 33 percent on an annualized basis. Around 20.5 million people abruptly lost their jobs in April, wiping out every job gained over the last 12 years of economic recovery from the GFC. In fact, we had not seen an economic collapse on this order of magnitude since the Great Depression, a period characterized by steep declines in consumer spending, investment, industrial output and jobs and dramatic increases in homelessness, poverty, and famine, eventually leading up to the second World War. The dramatic increase in debt and spending has been undertaken in an effort to avoid Americans facing that same fate. If given the choice of increased debt over poverty, I imagine every single American would choose the former.
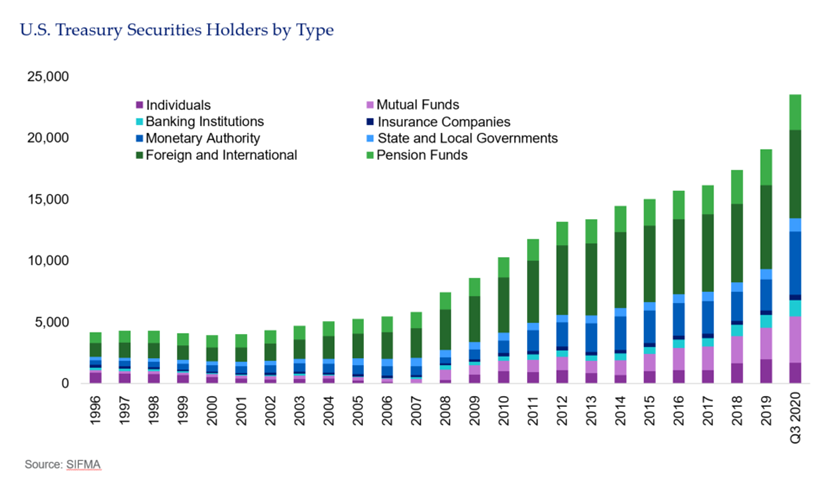
Finally, the world we live in today is fundamentally different than the world we lived in 60, 30, even 10 years ago! Our planet is global in nature. It is virtually impossible in today’s age to go through a single day without being impacted by globalization — whether it be the food we eat, the clothes we wear, what we read on Twitter, how we communicate, or how we manage our investment portfolios — our global supply chain is interconnected. This is also true and impactful in government spending. In more isolationist periods of our country’s history, one could look at the level of government debt and think there is only so much American citizens can purchase, along with concern that the more they purchased, the less money was available for other, more productive investment. This is known in economic circles as the “crowding-out effect,” which we will revisit shortly. However, in today’s world, the auction of U.S. Treasuries is done on a global basis, with now around 30 percent of U.S. government debt held by foreign entities. The globalization of financial markets has created greater demand for U.S. Treasuries, and therefore, a runway for greater supply of debt as well.
3. Should We Really Care?
There is little doubt that on a total amount and a per capita basis the U.S. has more debt than ever before in our modern history. At the same time there are reasons to believe that there is no imminent crisis that is likely to arise from these debt levels — at least not yet. It may be helpful to consider past circumstances where mountains of debt created a debilitating economic meltdown. By doing so we can assess whether some of the characteristics leading up to those problems are on the near-term horizon for the U.S. and evaluate the solutions that could forestall or minimize the impacts.
The World Bank identified 26 cases where a developed economy’s debt burden was greater than 100 percent of GDP since 1875. Given the often unique circumstances of those cases, we will briefly examine two that seem to have substantial significance and fairly universal application: WWII, and the post-Global Financial Crisis period. We can also look to the Great Depression in the early 30s for insight, but note that even at its very worst debt to GDP (DTG) only reached 42 percent.
With protectionism reducing trade, a debilitating stock market crash, and a dust bowl ravaging the interior of the country, then-President Hoover took the amazing step of raising taxes. At this point debt to GDP had more than doubled from 14 percent to 34 percent, but much of this increase was due to the decline in economic activity. Enter FDR, whose New Deal in the early 30s hiked the ratio to 40 percent where it largely remained until fairly deep into WWII. By the time the war ended, DTG had reached 114 percent. High levels of debt continued as WWII was quickly followed by recessions in 1948 and 49, the outbreak of the Korean War, and the military buildup related to the Cold War. Not surprisingly, the reasons for high levels of debt were simply due to the decision to join the Allied powers in engaging the Axis around the world. Wars, and their aftermaths, are after all expensive.
Interestingly, if we look at the post Korean War periods, DTG tended to fall as time passed, with increases occurring due to specific events such as recessions. During the years from 1951 to 1971, DGP actually went from 74 percent down to 34 percent, but that was again largely due to the tremendous growth of the U.S. economic engine. Actual debt levels over those 20 years increased by an average of 2.3 percent per year, while GDP increased by an amazing 6.3 percent per year. The moral to this story is that it is pretty easy to have your debt burden decline if your level of income is growing at almost three times your debt.
A combination of factors led to a near doubling of DTG over the next two decades. Military spending to win the Cold War with the then Soviet Union and the first Iraq war along with Reagan’s two tax cuts were mainly to blame, but still at a level of 60 percent the ratio wasn’t alarming. The U.S. debt habit was, however, taking a significant turn for the worse as debt for this period increased by over ninefold, while GDP, still growing rapidly, increased by only five times its 1971 level. During the period from 1991 through 2007 DTG remained fairly constant in the low 60 percent range and good economic times allowed something of a reversal of the debt binge, with actual debt increasing by 2.5X and GDP increasing by 1.8X.
And then came the GFC. And then COVID-19. U.S. government debt skyrocketed from 62 percent of GDP in 2008 to 136 percent by 2Q of 2020, a 3X increase, while GDP itself only increased by 34 percent during the entire 11-plus year span. This dramatic shift in the role of government in the economy was brought about by three principal events:
- The need to rescue the financial system, which appeared to be on the brink of collapse;
- The general economic concept that reducing taxes and increasing government spending would pay dividends via higher economic growth and ultimately higher tax revenues;
- The need to provide a backstop for the physical and economic disaster of a global pandemic.
There are a few key observations from this history and lessons for our future. First, when recessions occur it is natural for government to step up borrowing in order to support future growth and minimize the pain to citizens and businesses. Second, when those recessions end, government has tended to keep its spending pattern at the same levels, or even raising them somewhat. That is poor financial discipline. And third, when you are fighting a world war you have to do what it takes to maintain your economy while winning. The bad financial discipline during favorable economic environments makes dealing with the first and third events much more difficult.
What’s wrong with a lot of debt?
As noted, one issue is the ability to apply government fiscal intervention to shorten the duration or lessen the severity of economic downturns. As debt grows it is more difficult to respond to problems. There is the crowding out of private investing as the supply of debt increases and savings are redirected towards satisfying that need. Interest rates then are likely to rise, which puts pressure on the U.S. dollar, which decreases foreign demand for that debt, which causes rates to rise faster with higher debt service costs resulting in crowding out of government services that can be more supportive of economic growth. This downward spiral then becomes worse each time there is any decline in economic activity and reaches its nadir when lenders are no longer confident in the borrower’s ability to repay. Ultimately the level of debt will reduce economic growth (the World Bank pegs the breaking point at nearly 80 percent DTG) and could ultimately threaten the supremacy of the U.S. Dollar as the global reserve currency. This cycle of causes and effects is widely agreed upon in more traditional, “Keynesian” (a reference to renowned economist John Maynard Keynes) economic circles. However, as we will explore further, an alternative approach to debt levels and government spending has caught the attention of economists and media outlets across the globe.
What are the steps to lower the debt burden?
One obvious choice is to spend less. Difficult in a pandemic for sure and the side effect of potentially reducing economic growth, so perhaps a better general prescription would be to a. exercise improved financial discipline in the future by reducing spending in times of economic prosperity and b. spend smarter by focusing on spending in areas that are supportive of long term growth and productivity such as education and infrastructure. A second obvious choice is to increase revenues by raising taxes in some fashion. Again, the fear is that if taxes are raised too much or in the wrong way this will also result in a decline in economic activity as money is removed from the system. Tax policy has to be applied with a carving knife, not an axe, but generally this results in an even more complicated system often dominated by special interests. The most politically attractive way to reduce debt is to grow the economy faster hence the relative burden declines while tax revenues rise. The problem here is, how? Finally, there is simply printing money so that the debt can be paid off with some of the higher quantity of dollars in circulation. That is basically what is happening now as the Fed is buying government debt and inflating its balance sheet. The fear is that this can eventually result in bouts of inflation and increase interest rates, thus creating a different type of cycle with equal, or worse, long term consequences.
There is one other solution however — don’t worry about the debt at all!
4. Enter MMT – What Is It Anyway?
Modern Monetary Theory, or “MMT,” is an economic theory that was first publicized by a man named Warren Mosler, now considered the father of MMT, in his book titled Soft Currency Economics. The theory has a number of central tenets, however, its core application is to dispel what MMT calls “myths” related to federal deficits of fiat currency issuing governments (such as the United States) and their associated economic impacts. MMT posits that any monetary sovereign (e.g. the U.S., Australia, Japan, the U.K., etc.), who is in the unique position as the monopolistic issuer of a fiat currency, is not bound to the same budgetary and economic constraints as a user of that currency. MMT argues that because the monetary sovereign has the ability to issue its own currency, it also has the ability to monetize any deficit through the exclusive ability to print the currency. Said differently, the government can just pay its debt by printing more of its currency. Because of this, the harmful impacts experienced by households (i.e. users of the currency) when running a budget deficit do not apply to the government. In short, MMT proposes that the most effective means of cushioning the impact of economic recessions, and the quickest means of stimulating economic activity in a recovery, is through government spending irrespective of a budget.
One could argue that the Trump administration and Congress over the past year have been the largest real-world proponents of the concepts supporting MMT. In response to the COVID-19 pandemic, Congress passed a ~$2.5 Trillion fiscal stimulus program, supported by debt issuance from the Federal Reserve. While budget hawks of prior administrations or members of Congress would likely be clamoring for some sort of budgetary offset to this level of spending (entitlement program cuts for Republicans, higher taxes for Democrats), we have seen no such response from the current executive or legislative bodies. The $2.5 trillion in spending was done with no offset whatsoever, meaning it will further expand the federal deficit. MMT supporters argue this is the most appropriate and impactful approach to dealing with the economic consequences brought on by the pandemic. Whether or not President Trump, his cabinet, or any member of Congress explicitly supports MMT, actions certainly speak louder than words. This may be the first modern day real-world test of the theory and its potential economic impacts and/or consequences.
As MMT has garnered more attention in the broader macroeconomic discussion of today’s post-COVID world, the prominent opposition to the theory is that it is just that — a theory. More traditional or conventional economists have serious questions and concerns around the theory’s real world impacts, specifically related to inflation, productivity and highest economic use of resources, among others. There seems to be one universal concept that both MMT supporters and opponents can agree on — inflation is the ultimate governor (and possible consequence) of government spending. However, MMT supporters point to the lack of sustained inflation above the Federal Reserve’s 2 percent target over the last 10 years as proof that we are nowhere near hitting deficit or spending constraints. With the transition of power in the United States Presidency, it is possible a more progressive approach toward monetary and fiscal stimulus is embraced, potentially putting MMT into action.
MMT or OMG – what does the U.S. debt burden mean to the economy and markets?
Debt and debt service eventually have to matter even for the hegemony that is the U.S. Where that point is reached is unknowable, but we are undoubtedly getting closer to it. It appears most likely that the great reckoning will occur when we least expect it — with a severe recession or a spike in rates and inflation or a basket replacing the USD as the reserve currency. Today, none of these seems to be in the cards as we begin to leave the pandemic behind and fiscal and monetary stimulus pave the way for the next global economic expansion. In any case, we need to ask ourselves what the legacy of all this debt means for future generations in terms of their ability to soften downturns and make more productive investments in areas of needed improvement. For while today we may appear to be asymptomatic, there is no doubt that the extreme degree of our indebtedness has surely weakened our immune system.
The information and opinions herein provided by third parties have been obtained from sources believed to be reliable, but accuracy and completeness cannot be guaranteed. This article and the data and analysis herein is intended for general education only and not as investment advice. It is not intended for use as a basis for investment decisions, nor should it be construed as advice designed to meet the needs of any particular investor. On all matters involving legal interpretations and regulatory issues, investors should consult legal counsel.
