The month was a microcosm of the volatility encountered throughout the midpoint of 2026, driven by familiar headlines. Early June featured a tech sell-off driven by AI concerns that eventually reversed amid historic equity issuance to fund additional capital spending. SpaceX was the first of several expected mega-cap AI-related IPOs, becoming the largest in history after raising $75 billion at a valuation of $2.5 trillion, while Alphabet (Google) raised more than $80 billion in a secondary offering.

Mid-month featured the announcement of a U.S.-Iran deal to reopen the Strait of Hormuz, triggering a broad equity relief rally. Energy prices collapsed, with WTI crude oil falling 25 percent during the month to close below $70 per barrel after reaching $115 per barrel earlier in the year.
June 2026
| Equity | YTD (%) | MTD (%) |
|---|---|---|
|
All Cap U.S. Stocks |
|
|
|
Russell 3000 |
10.9 |
-0.3 |
|
Growth |
5.9 |
-2.7 |
|
Value |
16.6 |
2.3 |
|
Large Cap U.S. Stocks |
|
|
|
S&P 500® |
10.2 |
-1 |
|
Russell 1000 |
10.3 |
-0.5 |
|
Growth |
5.3 |
-2.7 |
|
Value |
16.3 |
2.3 |
|
Mid Cap U.S. Stocks |
|
|
|
S&P 400 |
17.3 |
3.6 |
|
Russell Midcap |
15.3 |
3.1 |
|
Growth |
7.3 |
2.7 |
|
Value |
17.6 |
3 |
|
Small Cap U.S. Stocks |
|
|
|
S&P 600 |
23.9 |
7.3 |
|
Russell 2000 |
22.6 |
3.7 |
|
Growth |
22.2 |
3.6 |
|
Value |
23.0 |
4 |
|
International |
|
|
|
MSCI EAFE NR (USD) |
9.4 |
0.1 |
|
MSCI EAFE NR (LOC) |
11.7 |
2.4 |
|
MSCI EM NR (USD) |
23.8 |
-1.4 |
|
MSCI EM NR (LOC) |
26.8 |
-0.1 |
| Fixed Income | YTD (%) | MTD (%) |
|---|---|---|
|
Bloomberg |
|
|
|
U.S. Aggregate |
0.6 |
0.2 |
|
U.S. Treasury: 1-3 Year |
0.6 |
0.1 |
|
U.S. Treasury |
0.3 |
0.3 |
|
U.S. Treasury Long |
0.4 |
1 |
|
U.S. TIPS |
1.2 |
-0.5 |
|
U.S. Credit: 1-3 Year |
1.1 |
0.1 |
|
U.S. Intermediate Credit |
0.7 |
0.1 |
|
U.S. Credit |
0.8 |
0.2 |
|
U.S. Intermediate G/C |
0.4 |
0.1 |
|
U.S. Govt/Credit |
0.5 |
0.3 |
|
U.S. Govt/Credit Long |
0.8 |
0.7 |
|
U.S. MBS |
1 |
0.2 |
|
U.S. Corp High Yield |
2 |
0.3 |
|
Global Aggregate (USD) |
-0.2 |
-0.7 |
|
Emerging Markets (USD) |
2 |
0.6 |
| Alternatives | YTD (%) | MTD (%) |
|---|---|---|
|
Bloomberg Commodity |
14.4 |
-8.5 |
|
S&P GSCI |
24.1 |
-9.9 |
Sources: Standard & Poor's, Bloomberg, MSCI and Russell
The S&P indices are a product of S&P Dow Jones Indices, LLC and/or its affiliates (collectively, “S&P Dow Jones”) and has been licensed for use by Segal Marco Advisors. ©2026 S&P Dow Jones Indices, LLC a division of S&P Global Inc. and/or its affiliates. All rights reserved. Please see www.spdji.com for additional information about trademarks and limitations of liability.
Macroeconomics
Federal Reserve Chair Kevin Warsh held his first FOMC press conference after the committee held interest rates at 3.50–3.75 percent this month. The Consumer Price Index (CPI) rose at an annualized rate of 4.2 percent in May, driven by energy prices. The Fed’s preferred measure of core Personal Consumption Expenditures (PCE), which excludes food and energy, rose at an annualized rate of 3.4 percent in May. The May BLS jobs report was stronger than anticipated, with payrolls increasing by 172,000, while prior months were revised higher by a combined 93,000 jobs and the unemployment rate held at 4.3 percent.
The Conference Board Consumer Confidence Index edged higher in June to 91.2. The ISM U.S. Manufacturing Purchasing Managers’ Index (PMI) decreased in June to 53.3, marking the sixth straight month of expansion despite mixed results in the underlying components, which showed the overall economy growing at a slower pace. The U.S. Dollar Index increased 2.3 percent for the month and served as a headwind for international asset returns.
Equity markets
Markets were volatile in June as the S&P 500 declined 1.0 percent to close at 7,499, but posted a strong second-quarter return of 15.2 percent and was up 10.2 percent for the first half of the calendar year. Sector performance varied widely this month, with Industrials (+7.3 percent) and Healthcare (+6.6 percent) leading, while several sectors were negative, with Communication Services (-7.8 percent) and Energy (-5.1 percent) trailing. Small- and mid-cap stocks were positive and led large-cap stocks on a relative basis. Value outperformed growth on a relative basis, while the S&P 500 equal‑weighted index outperformed the cap‑weighted index.
International equity markets were also volatile this month, with developed markets (EAFE) barely positive at +0.1 percent and ahead of emerging markets (EM), which were in negative territory at -1.4 percent. EAFE performance on a relative basis by region had Europe (+1.0 percent) ahead of Pacific (-1.1 percent). EM performance on a relative basis by region had Asia (-1.1 percent) ahead of Eastern Europe (-1.5 percent) and Latin America (-2.4 percent). The Netherlands (+11.8 percent) led major developed market countries, while Colombia (+12.4 percent) led emerging market countries.
Fixed income markets
Fixed income markets were volatile again, as the month started with concerns about elevated inflation that moderated in the closing weeks, with the Bloomberg U.S. Aggregate Index up +0.2 percent. The U.S. Treasury yield curve flattened further as yields rose across the front and middle portions amid concerns about elevated inflation and new Fed leadership, while the long end declined amid concerns about growth and the fiscal outlook. Investment-grade (IG) corporate and high-yield spreads remained stable amid resilient fundamentals and increased issuance, while mortgage-backed securities benefited from lower prepayment risks as rates remained elevated, enhancing cash flow stability.
United States Treasury Yield Curve
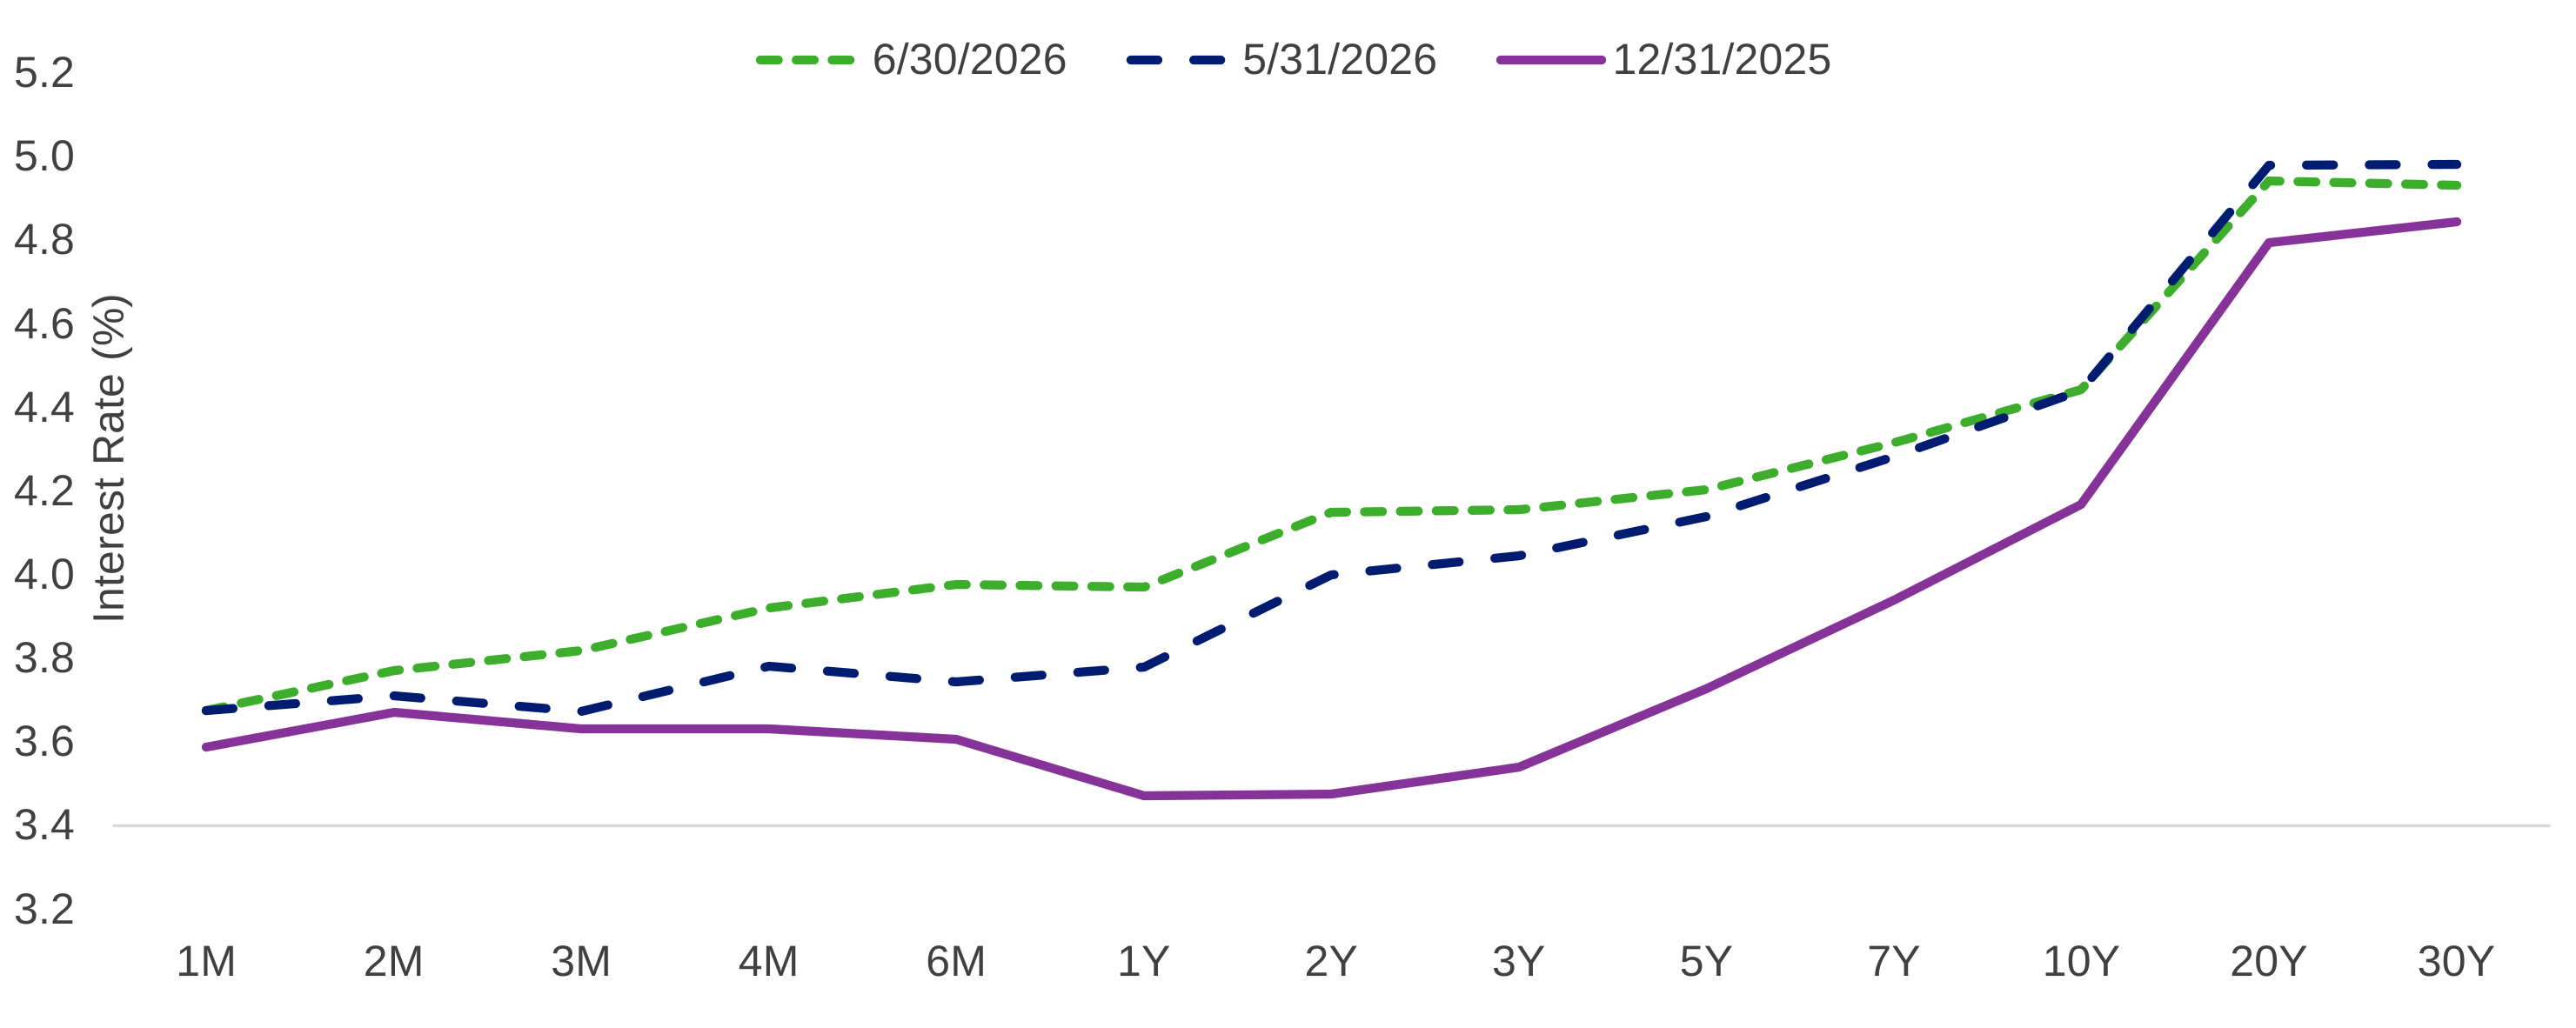
Source: FactSet
Looking ahead
Markets are fluctuating between familiar geopolitical headlines and the impact of AI. The reduction in energy prices is helpful from a near-term inflation perspective, but energy should remain a critical focus as the midterm election cycle ramps up. Investors should remain vigilant about concentrated exposure to mega-cap technology companies as the AI build-out continues to meaningfully affect market valuations and performance. Markets will continue to closely watch new Fed Chair Warsh’s public comments for insight into the degree of forward guidance he may provide about upcoming rate decisions. Recently, he acknowledged that while inflation remains too elevated, risks have abated somewhat, but he also resisted providing clues about possible future monetary policy moves.
See more insights

May 2026 Market Update

Segal Marco Advisors Names Co-Presidents Seth Almaliah and John Marco to Lead Next Era of Growth

April 2026 Market Update
The information and opinions herein provided by third parties have been obtained from sources believed to be reliable, but accuracy and completeness cannot be guaranteed. This article and the data and analysis herein is intended for general education only and not as investment advice. It is not intended for use as a basis for investment decisions, nor should it be construed as advice designed to meet the needs of any particular investor. On all matters involving legal interpretations and regulatory issues, investors should consult legal counsel.