Global financial markets declined amid the first rate hike by the Federal Reserve in three years to tame persistent inflation. An AI-dominated economy and strong corporate profits showed resiliency despite continued elevated oil prices from the ongoing U.S.-Iran conflict, as Brent crude climbed roughly 18 percent this month to reach $107 per barrel. Uncertain trade and tariff policies added to the complex macro environment.

The dominant story this month was a U.S. Treasury selloff, as yields increased along the entire curve from overnight to 30-years, while sentiment over rising government deficits, energy prices, economic growth and evolving central bank policy framework repeated itself across other global government bonds.
September 2026
| Equity | YTD (%) | MTD (%) |
|---|---|---|
|
All Cap U.S. Stocks |
|
|
|
Russell 3000 |
12.4 |
-0.8 |
|
Growth |
6.4 |
1.8 |
|
Value |
19.2 |
-3.2 |
|
Large Cap U.S. Stocks |
|
|
|
S&P 500® |
12.7 |
-0.3 |
|
Russell 1000 |
12.3 |
-0.6 |
|
Growth |
6.3 |
2.2 |
|
Value |
19.3 |
-3.1 |
|
Mid Cap U.S. Stocks |
|
|
|
S&P 400 |
9.9 |
-4.2 |
|
Russell Midcap |
11.8 |
-4.2 |
|
Growth |
1 |
-1.8 |
|
Value |
15.3 |
-5 |
|
Small Cap U.S. Stocks |
|
|
|
S&P 600 |
14.1 |
-5.6 |
|
Russell 2000 |
13.7 |
-5.3 |
|
Growth |
10.7 |
-5.3 |
|
Value |
17.0 |
-5.2 |
|
International |
|
|
|
MSCI EAFE NR (USD) |
10.3 |
-3.1 |
|
MSCI EAFE NR (LOC) |
12.4 |
-1.7 |
|
MSCI EM NR (USD) |
23.4 |
-0.6 |
|
MSCI EM NR (LOC) |
23.1 |
-0.4 |
| Fixed Income | YTD (%) | MTD (%) |
|---|---|---|
|
Bloomberg |
|
|
|
U.S. Aggregate |
-2.9 |
-2.6 |
|
U.S. Treasury: 1-3 Year |
0.5 |
-0.6 |
|
U.S. Treasury |
-2.8 |
-2.2 |
|
U.S. Treasury Long |
-7.6 |
-5 |
|
U.S. TIPS |
-2.1 |
-2.6 |
|
U.S. Credit: 1-3 Year |
0.9 |
-0.6 |
|
U.S. Intermediate Credit |
-1.5 |
-1.9 |
|
U.S. Credit |
-3 |
-2.7 |
|
U.S. Intermediate G/C |
-1.5 |
-1.7 |
|
U.S. Govt/Credit |
-2.8 |
-2.4 |
|
U.S. Govt/Credit Long |
-7 |
-4.8 |
|
U.S. MBS |
-3.3 |
-3.4 |
|
U.S. Corp High Yield |
0.1 |
-2.5 |
|
Global Aggregate (USD) |
-2.7 |
-2.4 |
|
Emerging Markets (USD) |
-1.5 |
-2.9 |
| Alternatives | YTD (%) | MTD (%) |
|---|---|---|
|
Bloomberg Commodity |
32.9 |
0.6 |
|
S&P GSCI |
55.2 |
4.8 |
Sources: Standard & Poor's, Bloomberg, MSCI and Russell
The S&P indices are a product of S&P Dow Jones Indices, LLC and/or its affiliates (collectively, “S&P Dow Jones”) and has been licensed for use by Segal Marco Advisors. ©2026 S&P Dow Jones Indices, LLC a division of S&P Global Inc. and/or its affiliates. All rights reserved. Please see www.spdji.com for additional information about trademarks and limitations of liability.
Macroeconomics
At their most recent Federal Open Market Committee (FOMC) meeting, the central bank voted unanimously to end a two-year cutting cycle by raising the Federal Funds Rate by 25 bps to a range of 3.75-4.00 percent. In rendering its decision, the board prioritized price stability and the return of inflation to a 2 percent target, given that the unemployment rate of 4.1 percent is currently viewed as running in line with full employment. This was a reputational move; Chair Kevin Warsh stated, “We removed a dose of accommodation so that financial and credit conditions would be more consistent with our ultimate objectives. Today's action starts to show we're serious.” As for forward rate guidance, the Fed’s “dot plot” (projection for the funds rate) at the end of 2026 shows a consensus median estimate of one more 25 bps increase to 4.0 percent. This perspective includes 16 committee participants expecting at least one more rate hike by year-end, while four expect two more. There is more divergence moving forward into 2027 and later, given that the current bout of inflation is primarily supply-driven shocks from both the Iran war pushing up oil prices and AI’s demand for memory chips.
The Fed’s preferred inflation measure of core Personal Consumption Expenditures (PCE), which excludes food and energy, increased at a lower-than-expected monthly rate of +0.2 percent in August with an annualized rate of 3.0 percent. The August headline Consumer Price Index (CPI) rose 0.4 percent and an annualized rate of 3.4 percent, while core CPI (ex-food and energy) was up 0.3 percent for the month and 3.0 percent for the year. The August numbers were lower than expected, but core inflation remains above target. The Producer Price Index (PPI) showed wholesale prices accelerating in August with a 0.4 percent increase during the month and 5.4 percent annualized — driven mostly by energy and goods costs. The September BLS jobs report was weaker than anticipated, with payrolls increasing by 29,000 as the unemployment rate nudged higher to 4.2 percent and prior months (July and August) revised downward by 60,000. The Conference Board Consumer Confidence Index decreased sharply in September to 81.9.
Equity markets
The S&P 500 ended the month on a negative note at -0.3 percent, yet remains near striking distance of its recent August all-time high close. Sector performance varied widely, with only IT (+4.5 percent) and Communication Services (+4.3 percent) in positive territory; all other sectors were negative as Financials (-7.2 percent) and Materials (-6.7 percent) trailed. Small- and mid-cap stocks were also negative and trailed large-cap stocks on a relative basis. Growth outperformed value comparatively, while the S&P 500 equal‑weighted index (-4.8 percent) trailed the cap‑weighted index.
International equity markets were also negative this month, with emerging markets (EM) ahead of developed markets (EAFE). EM performance on a relative basis by region had Eastern Europe (+6.3 percent) ahead of Asia (+3.3 percent) and Latin America (-0.7 percent). EAFE performance on a relative basis by region had Pacific (+3.1 percent) leading Europe (+1.4 percent). Ireland (+9.1 percent) led major developed market countries, while South Africa (+11.5 percent) led emerging market countries.
Fixed income markets
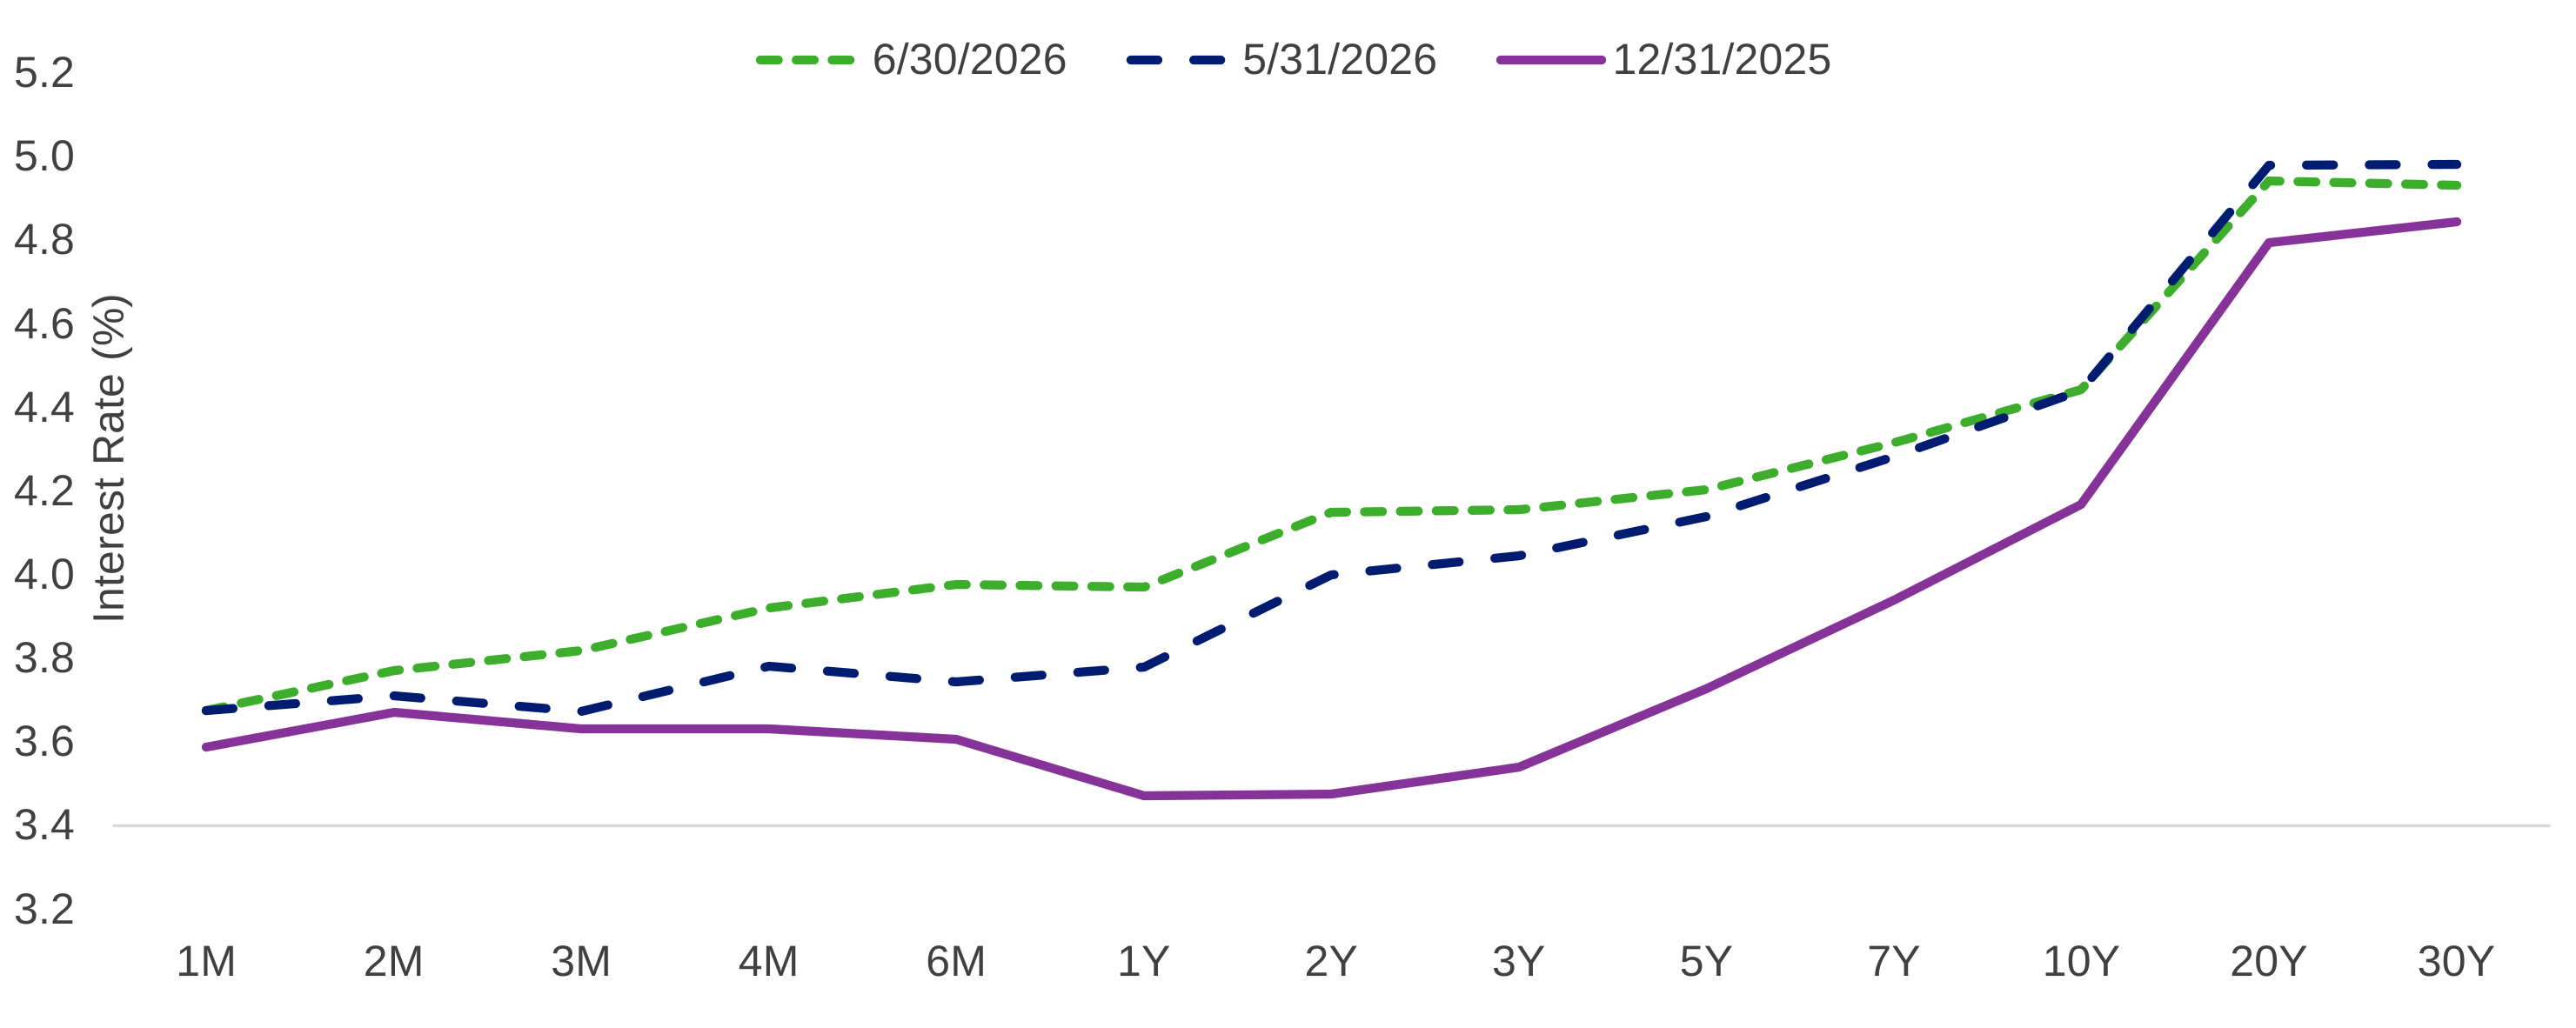
Fixed income markets declined sharply, with the Bloomberg U.S. Aggregate Index down -2.6 percent. The U.S. Treasury yield curve shifted higher as yields rose across the spectrum, with a more prominent bump in the short and middle portions amid concerns about elevated inflation and fiscal outlook. All major aggregate index components were negative, as the 10-year Treasury yield surged from 4.80 percent to 5.29 percent to reach its highest level since 2007. Treasuries outperformed on a relative basis as spreads widened across Corporate Investment Grade (IG), High Yield (HY) and Mortgage-Backed Securities (MBS). Issuance of both IG and HY Corporate supply remained robust, but lower-quality issuers were more sensitive to rising market volatility.
United States Treasury Yield Curve
Source: FactSet
Looking ahead
The focus will be on whether any de-escalation of the U.S.-Iran conflict begins to reduce pressure on energy prices and surging global bond yields. Domestically, attention will be on the congressional midterm elections, and anticipation as to whether a leadership change will impact corporate taxes, regulations and trade policy. Investors will be assessing the Federal Reserve policy trajectory, and whether sticky inflation levels remaining above target will continue a hawkish approach. Markets are anticipated to remain on alert, as the AI trade continues to drive global equity performance, and U.S. GDP growth is projected to remain steady, but stresses from higher oil prices and interest rates remain headwinds to robust earnings.
See more insights

June 2026 Market Update

May 2026 Market Update

Segal Marco Advisors Names Co-Presidents Seth Almaliah and John Marco to Lead Next Era of Growth
The information and opinions herein provided by third parties have been obtained from sources believed to be reliable, but accuracy and completeness cannot be guaranteed. This article and the data and analysis herein is intended for general education only and not as investment advice. It is not intended for use as a basis for investment decisions, nor should it be construed as advice designed to meet the needs of any particular investor. On all matters involving legal interpretations and regulatory issues, investors should consult legal counsel.